
Mean vs median: which average should you use?


On this page
Key takeaways
- The mean adds every value and divides by the count. The median is the middle value of a sorted list.
- One extreme value can move the mean a long way. It barely moves the median.
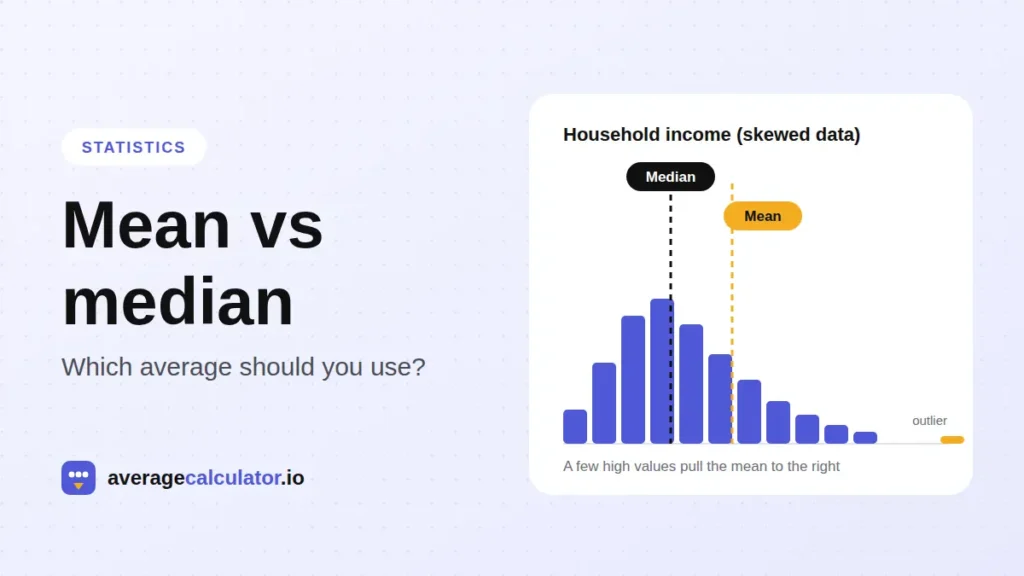
- If the mean is well above the median, a few high values are pulling it up. Report the median, or both.
- Use the mean when you need the total back, such as budgets or grades where every score counts.
- Income, house prices and wait times are usually reported as medians for this reason.
The mean is the sum of all values divided by how many there are. The median is the middle value once the list is sorted. Use the mean when your numbers are fairly even with no extreme values. Use the median when a few very large or very small values would drag the mean away from what is typical, as with incomes, house prices and wait times.
Both are called “averages” in everyday speech, which is why the two get mixed up. They answer slightly different questions. The mean tells you what each value would be if the total were shared out equally. The median tells you where the middle of the group sits.
Mean vs median at a glance
| Mean | Median | |
|---|---|---|
| What it is | Sum of values / number of values | Middle value of a sorted list |
| Uses every value? | Yes | Only the middle one or two |
| Pulled by outliers? | Yes, strongly | Barely |
| Best for | Even, symmetric data | Skewed data or data with outliers |
| Lets you get back the total? | Yes (mean × count) | No |
| Typical uses | Test scores, temperatures, measurements | Income, house prices, response times |
What is the mean?
The mean, or arithmetic mean, is what most people mean by “the average.” Add every value, then divide by the count.
mean = (x₁ + x₂ + … + xₙ) / n
Five quiz scores of 72, 85, 90, 78 and 95 add up to 420. Divided by 5, the mean is 84.
Every value affects the mean. That is its strength, because it uses all your data. It is also its weakness, because one strange value moves it.
What is the median?
The median is the value in the middle after you sort the list from smallest to largest. Half the values sit below it and half sit above it, which is why it is also called the 50th percentile.
With an odd number of values, the median is the single middle value. Sorted, the quiz scores are 72, 78, 85, 90, 95, so the median is 85.
With an even number of values, there are two middle values. Add them and divide by 2. For 3, 5, 8 and 10, the median is (5 + 8) / 2 = 6.5. So the median does not have to be a number that appears in your list.
Is the median the same as the average?
In everyday language, “average” nearly always means the mean. In statistics, “average” is a family name that covers the mean, the median and the mode. So the median is a kind of average, but it is usually not the number people mean when they say “the average.”
This matters when you read headlines. “The average home price” and “the median home price” can be tens of thousands of dollars apart for the same market.
Why outliers move the mean but not the median
Take six houses sold on one street: $310,000, $325,000, $340,000, $355,000, $360,000 and one large lakefront property at $2,100,000.
- Mean: $3,790,000 / 6 = $631,667
- Median: the two middle prices are $340,000 and $355,000, so ($340,000 + $355,000) / 2 = $347,500
The mean says a typical house costs over $630,000, yet five of the six sold for $360,000 or less. The median describes this street far better. If the lakefront house sold for $5 million instead, the mean would jump to over $1.1 million. The median would not move at all.
That resistance to extreme values is why statisticians call the median a robust measure. It does not ignore outliers, since they still count toward which value sits in the middle. They just cannot drag it around.
How skewed data tells you which to use
The gap between the mean and the median tells you the shape of your data.
- Mean close to median: the data is roughly symmetric. Either one works, and the mean is usually the one people expect.
- Mean above median: the data is right-skewed. A few high values stretch the upper tail, as with incomes, house prices or the time it takes to answer support tickets.
- Mean below median: the data is left-skewed. A few low values pull the mean down.
Here is a left-skewed example. A student scores 88, 91, 85, 90 and 87 on five tests and misses the sixth, which counts as 0. The mean is 441 / 6 = 73.5. The median is (87 + 88) / 2 = 87.5. Neither number is wrong. The mean shows the grade the zero will produce if every test counts equally. The median shows how the student usually performs.
A quick rule of thumb: if the mean and median differ by more than about 10% of the median, look at the data before you pick one. Something is pulling on the mean.
When to use the mean vs the median
Use the mean when:
- The values are fairly even and there are no extreme outliers, such as the heights of adults in a class or daily temperatures in one month.
- You need the total. Mean × count gives you the sum back, so the mean is the right figure for budgets, average spend per order when you want revenue, or the average grade when every assignment counts.
- You will use the number in further calculations, such as standard deviation or a statistical test that is built on the mean.
Use the median when:
- A few very large or very small values would give a misleading picture: household income, salaries, home prices, net worth.
- The data has a natural floor but no ceiling. Wait times, delivery times and page load times cannot go below zero but can run very long.
- You want to describe the typical case to a general audience, who will read “average” as “what most people get.”
When in doubt, report both. A sentence like “the mean response time was 4.2 minutes, and the median was 1.8 minutes” tells the reader that most tickets are fast and a few take very long.
A real example: household income
Income is the textbook case for the median. The US Census Bureau’s headline figure is median household income, which was $87,460 in 2025, according to its September 2026 release. A small share of households earn many times more than everyone else. Those incomes would lift the mean well above what a typical household earns, so the median gives the fairer picture.
Salary surveys work the same way. A job listing that says “median salary $62,000” means half the people in that role earn less and half earn more. An “average salary” in the same field is usually higher.
Where the mode fits in
The mode is the value that appears most often. It is the only one of the three that works for categories, such as the most common shoe size or the most popular answer on a survey. For numbers, the mode is often less useful, because a list can have no mode or several. When people compare “mean vs median vs mode,” the mean and median are usually the real contenders.
How to find the mean and median quickly
For a handful of numbers, the steps above are quick by hand. For a longer list, paste it into our average calculator. It shows the mean and the median side by side with the working for each. When the two are far apart, it tells you so, which is often the first sign of an outlier.
In Excel and Google Sheets, use the same two functions:
- =AVERAGE(A2:A20) for the mean
- =MEDIAN(A2:A20) for the median
Both functions skip empty cells and text but count zeros. If a missing value should be left out, leave the cell blank instead of typing 0.
If some values should count more than others, such as a final exam worth 50% of a grade, you need a weighted mean instead. The weighted average calculator handles that.
Frequently asked questions
Is the mean or the median more accurate?
Neither is more accurate in general. Each one is accurate for a different question. The mean is the exact balance point of the data and keeps the total. The median is the exact middle. For skewed data, the median usually describes a typical value better, and for even data the mean does.
When should I use the median instead of the mean?
Use the median when your data has outliers or is skewed, as with income, house prices, net worth or wait times. If the mean and median are far apart, the median is usually the better summary of a typical value.
Can the mean and median be the same?
Yes. In perfectly symmetric data they are equal. For 2, 4, 6, 8 and 10, both the mean and the median are 6. In real data they are rarely identical, but they are close when the data is roughly balanced.
Why is median income used instead of average income?
A small number of very high incomes pull the mean up, so the mean overstates what a typical household earns. The median is the income of the household in the middle, which is closer to most people’s experience.
Is the median the same as the 50th percentile?
Yes. Half the values are at or below the median and half are at or above it, which is the definition of the 50th percentile.
Which average is best for skewed data?
The median. Skew pulls the mean toward the long tail, while the median stays with the bulk of the data.
Does the median ignore outliers?
Not exactly. Outliers still decide which value lands in the middle. But their size does not matter, so a value of 1,000 affects the median no more than a value of 100 in the same position.
Can the median be a number that is not in the data?
Yes. With an even number of values, the median is the mean of the two middle values, and that number may not appear in your list.
About the author
More from the blog
Spotted a mistake in this article? Tell us the numbers you used and what you expected, and we will check it.
Report an error