
Four quartile methods, one data set, three answers for Q1


On this page
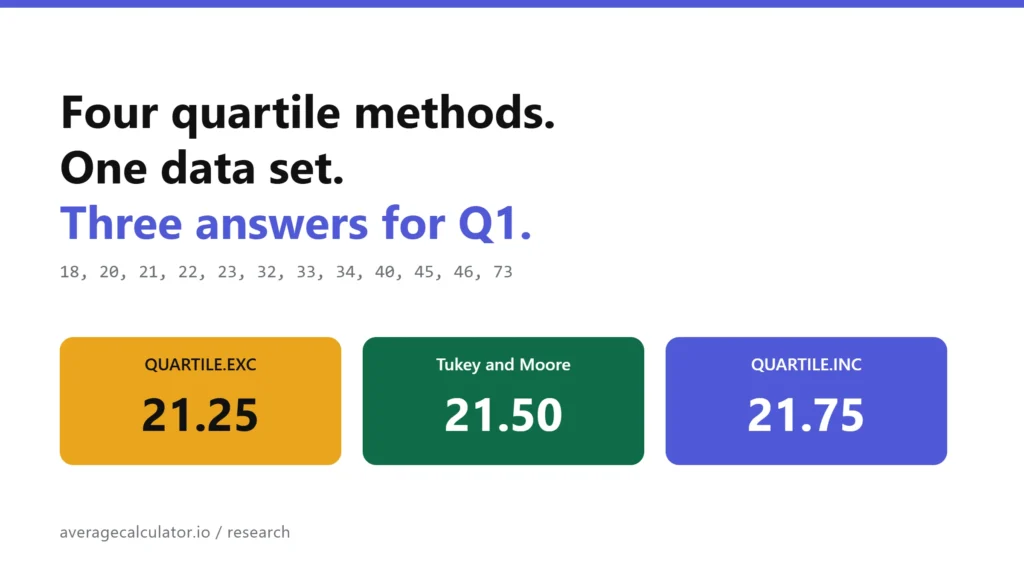
Put twelve numbers into Excel, into R, and into a statistics textbook, then ask each one for the first quartile. You get three different answers. We ran the four quartile methods in common use, plus all nine sample quantile types defined by Hyndman and Fan, across 23,760 random data sets. When the data held no repeated values, the four methods never once agreed on a single value for Q1. An odd count gives you two answers. An even count gives you three. That disagreement then flows straight into the 1.5 x IQR outlier rule: across 200,000 samples drawn from the same normal distribution, QUARTILE.INC flagged at least one outlier in 30.44 percent of them and QUARTILE.EXC in 17.07 percent.
How we tested
Four methods cover almost everything you will meet in practice.
- QUARTILE.INC, the inclusive method, and Hyndman and Fan type 7. It is what the QUARTILE and QUARTILE.INC functions return in Excel, and the default in numpy, pandas and R.
- QUARTILE.EXC, the exclusive method in Excel, and type 6. It is also what Python’s own statistics module hands you unless you ask for something else.
- Tukey hinges, which split the sorted data at the median and keep the median in both halves when the count is odd. R’s fivenum() uses these, and so does the box plot R draws by default.
- Moore and McCabe, the same split with the median dropped. This is the version taught in a lot of introductory courses.
We wrote one reference implementation of all nine Hyndman and Fan types in Python, built from their published definitions rather than copied from a library, then checked it two ways. Against numpy 2.4.4 it matched on all 216,000 comparisons, across every type, six probabilities and sample sizes from 2 to 40. Against R 4.3.3 it matched on 1,620 comparisons with a largest difference of 2.8e-13, which is floating point noise rather than disagreement.
Ten engines were run directly for the results table: Microsoft Excel for Microsoft 365 (version 2609, build 16.0.20430.20032, 64-bit), Google Sheets, LibreOffice Calc 24.2.7.2, R 4.3.3 (quantile, IQR, fivenum and boxplot.stats), numpy 2.4.4, pandas 3.0.2, scipy 1.17.1, the statistics module in Python 3.11.15, d3-array 3.2.4 and simple-statistics 7.12.1 on Node 22. In each of the three spreadsheets we ran QUARTILE.INC, QUARTILE.EXC, the legacy QUARTILE, PERCENTILE.INC and PERCENTILE.EXC over both data sets, along with the interquartile ranges and the four fences derived from them. Every result matched the reference implementation. LibreOffice was run headless from the command line, the other two in their own interfaces.
The simulations used Python’s Mersenne Twister with fixed seeds. Each outlier run drew 200,000 samples, with sizes picked uniformly between 8 and 30 and values from a normal distribution with mean 100 and standard deviation 15. The structural runs sampled integers without replacement, so no data set contained a repeated value. Ties get their own section further down, because they change the result.
One data set carries most of the article. Twelve support tickets, resolution time in hours, sorted: 18, 20, 21, 22, 23, 32, 33, 34, 40, 45, 46, 73.
What we found
All four methods are one formula read at a different position
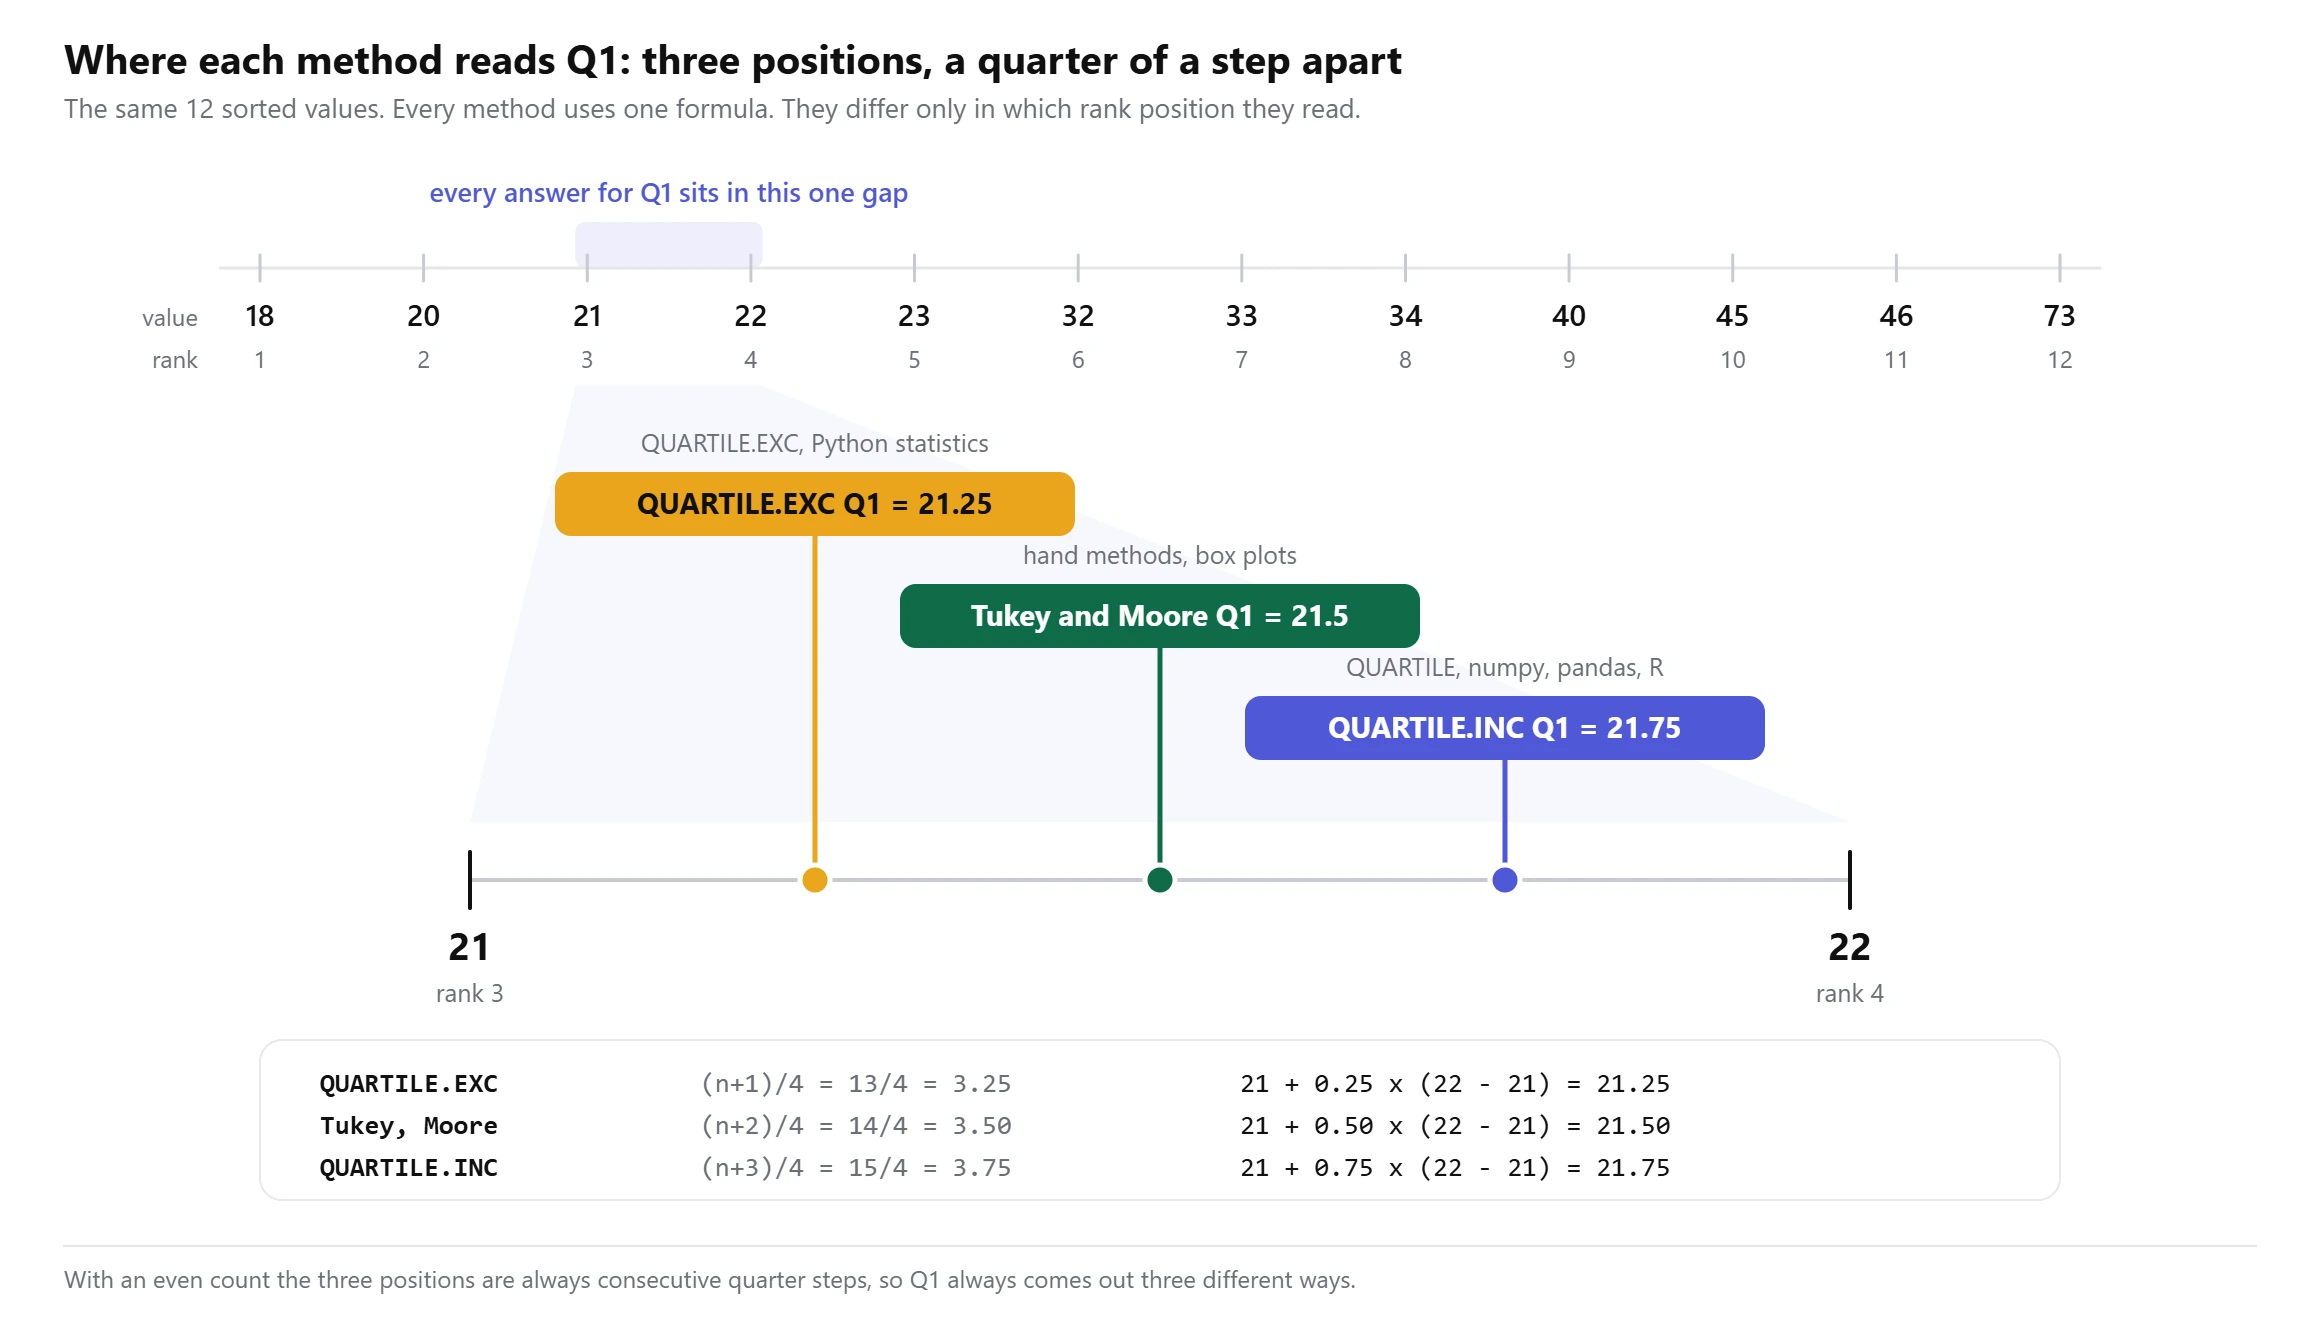
Sort the data and number the values from 1. Every method then reads the list at a rank position, taking a weighted blend of the two neighbouring values when the position lands between them. The methods differ in that position and in nothing else.
For Q1, QUARTILE.EXC reads at (n+1)/4, the hinge methods read at (n+2)/4, and QUARTILE.INC reads at (n+3)/4. Q3 mirrors it: QUARTILE.INC reads at (3n+1)/4, the hinges at (3n+2)/4, and QUARTILE.EXC at (3n+3)/4. We checked this against the four methods on 23,760 data sets with sizes from 4 to 300 and found no exceptions.
With twelve tickets the three Q1 positions are 3.25, 3.50 and 3.75. All three sit in the single gap between the third value, 21, and the fourth, 22. That gap is one hour wide, and the three methods cut it into quarters.
Whether you get two answers or three depends only on whether your count is odd or even
When n is even, those three positions are consecutive quarter steps, so they always land on three distinct values. Tukey and Moore and McCabe coincide, because with an even count there is no middle value to argue about. You get three answers.
When n is odd, the hinge position collapses onto one of the others. Tukey matches QUARTILE.INC exactly, and Moore and McCabe matches QUARTILE.EXC exactly. You get two answers. This is not an approximation that happens to hold most of the time, it is an identity: for odd n the arithmetic of keeping or dropping the median reproduces the type 7 and type 6 positions exactly.
What you never get, on data with no repeated values, is one answer. Across every size from 4 to 300 the four methods produced two values for Q1 at odd n and three at even n, with no exceptions in 23,760 data sets.
QUARTILE.INC always gives the narrowest interquartile range and QUARTILE.EXC the widest
This follows from the positions. QUARTILE.INC reads Q1 at the highest of the three positions and Q3 at the lowest, so its quartiles sit closest together. QUARTILE.EXC does the reverse. The ordering held on all 23,760 data sets with no exceptions, which makes it a property of the formulas rather than a tendency in the data.
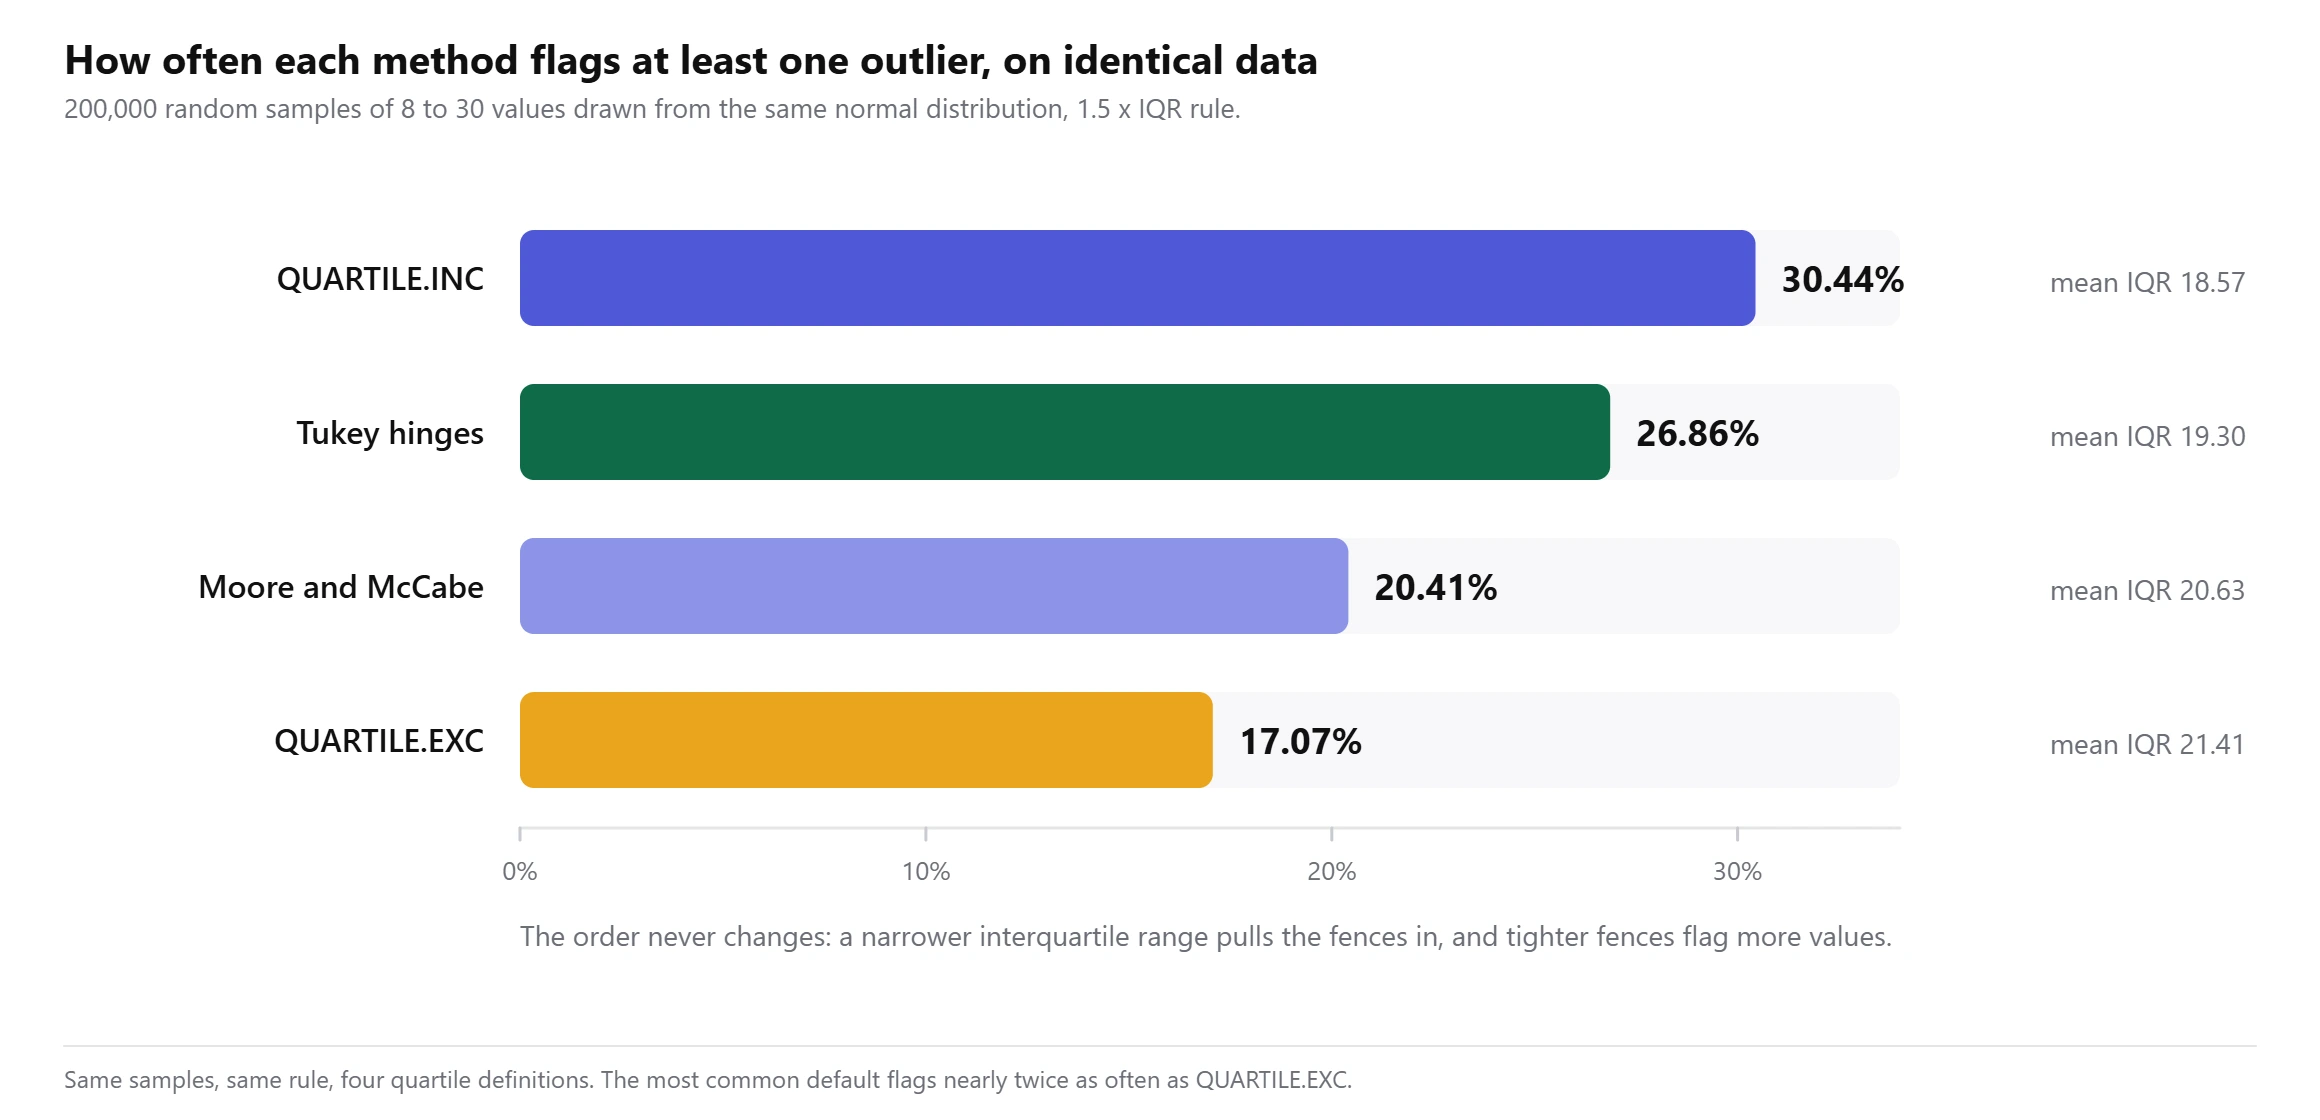
The size of the effect is not small. On the 200,000 normal samples, mean IQR was 18.57 for QUARTILE.INC and 21.41 for QUARTILE.EXC, about 15 percent wider. Looking at it one sample at a time, the gap between the widest and narrowest IQR the four methods give was 12.5 percent at the median, and more than 34.9 percent in one sample out of ten.
The outlier verdict changes in roughly one sample out of five
The 1.5 x IQR rule inherits all of this, because it is built from Q1, Q3 and the distance between them. Feed the four methods the same sample and they do not always flag the same points.
On 200,000 normal samples of 8 to 30 values, the methods produced different sets of flagged points in 18.42 percent of samples. In 13.48 percent, at least one method reported a clean data set while another flagged something. Narrowing to samples of 8 to 12 pushed the disagreement rate to 20.53 percent and the clean-versus-flagged rate to 17.57 percent. Right-skewed data, which is what most counts and durations and prices look like, came out at 22.71 percent, and planting one genuinely distant value raised it to 23.49 percent rather than settling the argument.
Each method’s flag rate is fixed by its interquartile range, and the order never changes.
Three methods call this data clean, the fourth flags a value
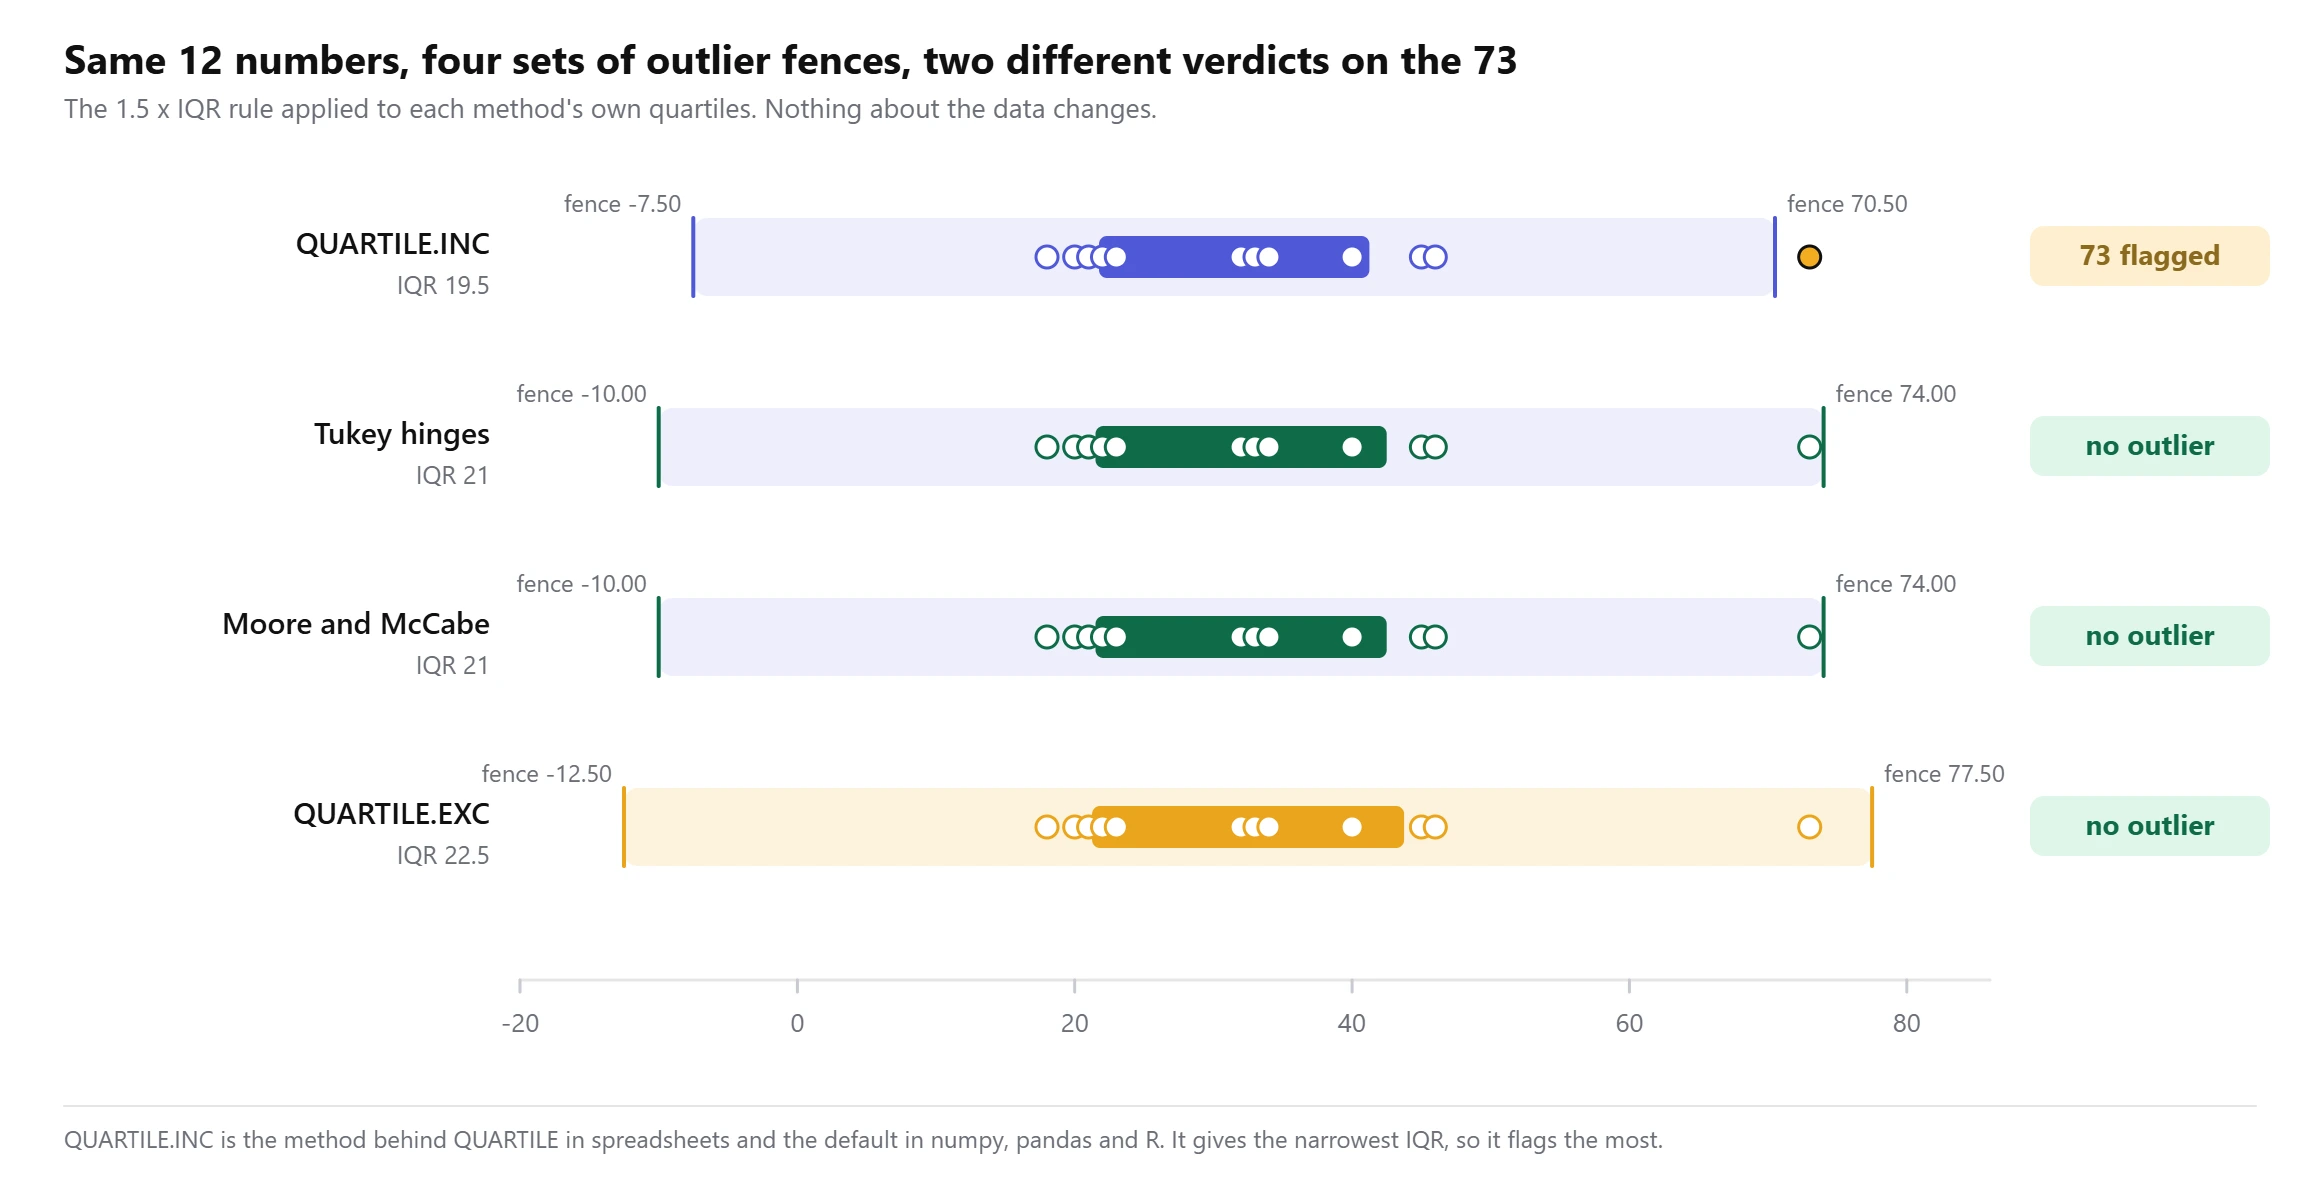
The twelve support tickets are a case where the split is visible rather than statistical. QUARTILE.INC puts the upper fence at 70.50 hours and flags the 73. The other three put it at 74.00 or 77.50 and report nothing unusual.
| Method | Q1 | Q3 | IQR | Lower fence | Upper fence | Flagged |
|---|---|---|---|---|---|---|
| QUARTILE.INC | 21.75 | 41.25 | 19.50 | -7.50 | 70.50 | 73 |
| Tukey hinges | 21.50 | 42.50 | 21.00 | -10.00 | 74.00 | none |
| Moore and McCabe | 21.50 | 42.50 | 21.00 | -10.00 | 74.00 | none |
| QUARTILE.EXC | 21.25 | 43.75 | 22.50 | -12.50 | 77.50 | none |
Running the same twelve numbers through R’s boxplot.stats() returns whiskers at 18 and 73 and an empty outlier list, because that function uses hinges. So the box plot drawn in R shows nothing out of place, while the same data screened in a spreadsheet with the default quartile function flags a ticket for review. Neither tool is broken. They are answering slightly different questions and both call the answer a quartile. Our IQR calculator prints all four side by side for exactly this reason, so you can see the spread before you commit to one.
Python’s standard library disagrees with numpy
This one surprised us. In Python 3.11.15, statistics.quantiles() defaults to the exclusive method, which is type 6, while numpy, pandas and scipy all default to type 7. On the twelve tickets the standard library returns Q1 of 21.25 and numpy returns 21.75. Two built-in tools, one language, one data set, two answers. Passing method='inclusive' to statistics.quantiles() brings it into line with numpy.
Nine library types give six or seven different values for Q1
Statistics libraries usually expose all nine Hyndman and Fan types, not just the two the spreadsheets use. Across 33,600 data sets of 5 to 60 distinct values, the nine types produced six distinct values for Q1 62.50 percent of the time and seven 37.50 percent of the time, for a mean of 6.375. The twelve tickets give six: 21, 21.25, 21.4167, 21.4375, 21.50 and 21.75.
Repeated values are what make the methods agree
Everything above assumes no two values are the same. Real data often breaks that assumption, and when it does the methods start agreeing, because a position of 3.25 and a position of 3.75 read the same number when ranks 3 and 4 hold the same value. We repeated the structural run with integers drawn from 1 to 20, the shape of rating scales and small counts, and all four methods agreed on Q1 in 40.9 percent of 33,600 data sets. Two distinct values came up 40.0 percent of the time and three 19.1 percent.
That is worth knowing in both directions. Survey data on a 1 to 5 scale will often hide the problem completely. Measured quantities such as times, weights and prices, where exact ties are rare, expose it on nearly every data set.
Full results
Every engine below was run on the twelve support tickets during this test. The method column gives the Hyndman and Fan type each one implements.
| Engine and function | Version | Q1 | Q3 | IQR | Method |
|---|---|---|---|---|---|
| Microsoft Excel, QUARTILE.INC | Microsoft 365, 2609 | 21.75 | 41.25 | 19.50 | type 7 |
| Microsoft Excel, QUARTILE.EXC | Microsoft 365, 2609 | 21.25 | 43.75 | 22.50 | type 6 |
| Microsoft Excel, legacy QUARTILE | Microsoft 365, 2609 | 21.75 | 41.25 | 19.50 | type 7 |
| Google Sheets, QUARTILE.INC | web, 6 October 2026 | 21.75 | 41.25 | 19.50 | type 7 |
| Google Sheets, QUARTILE.EXC | web, 6 October 2026 | 21.25 | 43.75 | 22.50 | type 6 |
| LibreOffice Calc, QUARTILE.INC | 24.2.7.2 | 21.75 | 41.25 | 19.50 | type 7 |
| LibreOffice Calc, QUARTILE.EXC | 24.2.7.2 | 21.25 | 43.75 | 22.50 | type 6 |
| R quantile(), default | 4.3.3 | 21.75 | 41.25 | 19.50 | type 7 |
| R IQR() | 4.3.3 | 19.50 | type 7 | ||
| R quantile(type = 6) | 4.3.3 | 21.25 | 43.75 | 22.50 | type 6 |
| R fivenum() | 4.3.3 | 21.50 | 42.50 | 21.00 | Tukey hinges |
| R boxplot.stats() | 4.3.3 | 21.50 | 42.50 | 21.00 | Tukey hinges, no outlier |
| numpy.percentile, default | 2.4.4 | 21.75 | 41.25 | 19.50 | type 7 |
numpy.percentile, method='weibull' | 2.4.4 | 21.25 | 43.75 | 22.50 | type 6 |
| pandas Series.quantile, default | 3.0.2 | 21.75 | 41.25 | 19.50 | type 7 |
| scipy.stats.iqr, default | 1.17.1 | 19.50 | type 7 | ||
statistics.quantiles(), default | Python 3.11.15 | 21.25 | 43.75 | 22.50 | type 6 |
statistics.quantiles(method='inclusive') | Python 3.11.15 | 21.75 | 41.25 | 19.50 | type 7 |
| d3.quantile | 3.2.4 | 21.75 | 41.25 | 19.50 | type 7 |
| simple-statistics quantile | 7.12.1 | 21.75 | 41.25 | 19.50 | type 7 |
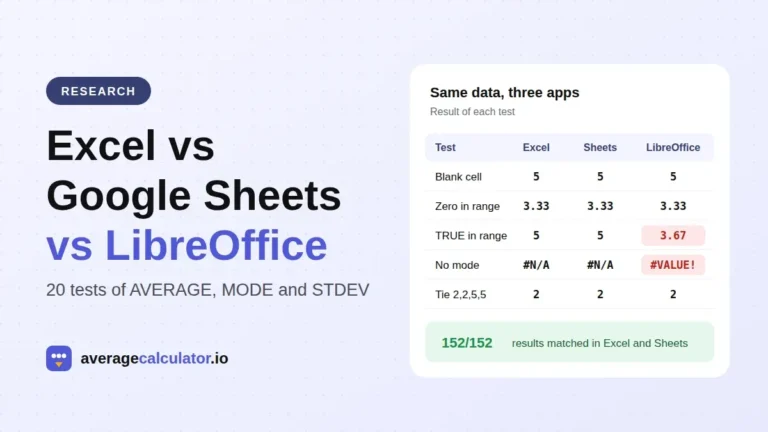
Eleven of the twenty entries are a tool’s default rather than a function we named, and eight of those eleven use type 7. That is why the inclusive answer feels like the standard one, even though nothing makes it more correct than the others. In all three spreadsheets the legacy QUARTILE matched QUARTILE.INC on both data sets, and PERCENTILE.INC and PERCENTILE.EXC returned the same pairs as their QUARTILE counterparts. The three agreed with each other on every value, which is worth stating because our earlier test of the same three found LibreOffice Calc parting company with the other two on several average and standard deviation functions. Quartiles are a place they line up. If you want to see the whole five number summary move at once, the five number summary calculator handles that, and the outlier calculator applies the 1.5 x IQR rule on its own.
What this means for your numbers
- Record which method produced a quartile before you publish it.
Q1 = 21.75is incomplete in the same way a measurement without units is incomplete. - Do not compare an interquartile range from one tool against one from another unless you have checked they use the same type. A 15 percent difference between two IQRs can be entirely definitional.
- Expect your box plot and your spreadsheet to disagree about outliers. A chart drawn with hinges and a fence calculated with QUARTILE.INC are not running the same test.
- If you screen for outliers, pick the method first and write it down. Choosing after you have seen which one flags the point you already suspected is not a test.
- Small samples are where this bites hardest. Below about a dozen values the methods disagree on the outlier set in roughly one sample out of five, and a single reading can move Q1 by a quarter of a gap.
- Repeated values mask the problem. If your data is on a small integer scale, the methods will often agree, and that agreement tells you about the scale rather than about the quartile.
None of the four methods is wrong. They are four reasonable ways to answer a question that has no single answer for a finite sample, which is where to put a cut point when no observation sits exactly at it. Our earlier test of Excel against Google Sheets found the two agreed on every comparable average and standard deviation, so the quartile split is not general spreadsheet unreliability. It is one specific place where the definitions genuinely differ, and the only fix available to you is to say which one you used.
About the author
How to cite this study
averagecalculator.io. "Four quartile methods, one data set, three answers for Q1." Updated October 2026. https://www.averagecalculator.io/quartile-methods-compared/
Copy citationJournalists and researchers: for questions about this data, email [email protected].
More from the blog
Spotted a mistake in this article? Tell us the numbers you used and what you expected, and we will check it.
Report an error