
Pie chart maker
Paste your labels and values to get a pie chart you can download, plus the percentage and the angle in degrees for every slice.

 By Catherine Risinger · Reviewed by Danielle Valentine✓ Fact-checked
How to use the pie chart maker
- 1Paste your data
One label and one value per line. A two-column block copied straight out of Excel or Google Sheets works, and so does Rent, 1200 typed by hand.
- 2Press Make pie chart
Every slice is sized by its share of the total, and the chart appears straight away.
- 3Read the numbers under it
You get the percentage and the angle in degrees for every slice, which is what most pie chart homework is really asking for.
- 4Tune it and download
Switch to a donut, move the legend, change the colours, then save it as a PNG for a report or an SVG you can edit later.
Chart title
How these percentages and angles were worked out
What is a pie chart?
A pie chart is a circle cut into slices, where each slice is sized by its share of the total. The whole circle is everything you measured, which is 100% and 360 degrees. A slice worth a quarter of the total takes a quarter of the circle, so 25% and 90 degrees.
That is the one thing a pie chart does that other charts do not do as directly: it shows parts against a whole. A bar chart tells you Rent is 1,200 and Groceries is 480. A pie chart tells you Rent is most of the money and Groceries is not.
It only works when the parts actually add up to something meaningful. Percentages of a budget, votes in an election, share of a market, hours in a day. If your numbers are separate measurements that do not sum to a whole, such as the temperature in five cities, a pie chart will still draw but it will not mean anything.
How to make a pie chart
Four steps, whether you are drawing it by hand with a protractor or checking what software gave you:
- Add all the values together. That total is the whole circle.
- For each category, divide its value by the total. That gives you its share as a decimal.
- Multiply that share by 100 for the percentage, and by 360 for the angle of the slice in degrees.
- Draw the slices one after another around the circle, starting at twelve o’clock and working clockwise.
Worked example
A monthly budget of 2,840 split six ways. Rent 1,200, Groceries 480, Savings 400, Transport 320, Everything else 250, Utilities 190.
Rent is 1,200 divided by 2,840, which is 0.4225. Multiply by 100 and Rent is 42.3% of the budget. Multiply by 360 instead and the Rent slice is 152.1 degrees, so it takes up a little under half the circle.
Do the same for the rest and you get 16.9% for Groceries, 14.1% for Savings, 11.3% for Transport, 8.8% for Everything else and 6.7% for Utilities. Click “Monthly budget” in the calculator above to see all six drawn, with the angles listed underneath.
How to work out pie chart percentages and angles
Both numbers come from the same division. Only the multiplier changes.
Percentage = (value ÷ total) × 100
Angle in degrees = (value ÷ total) × 360
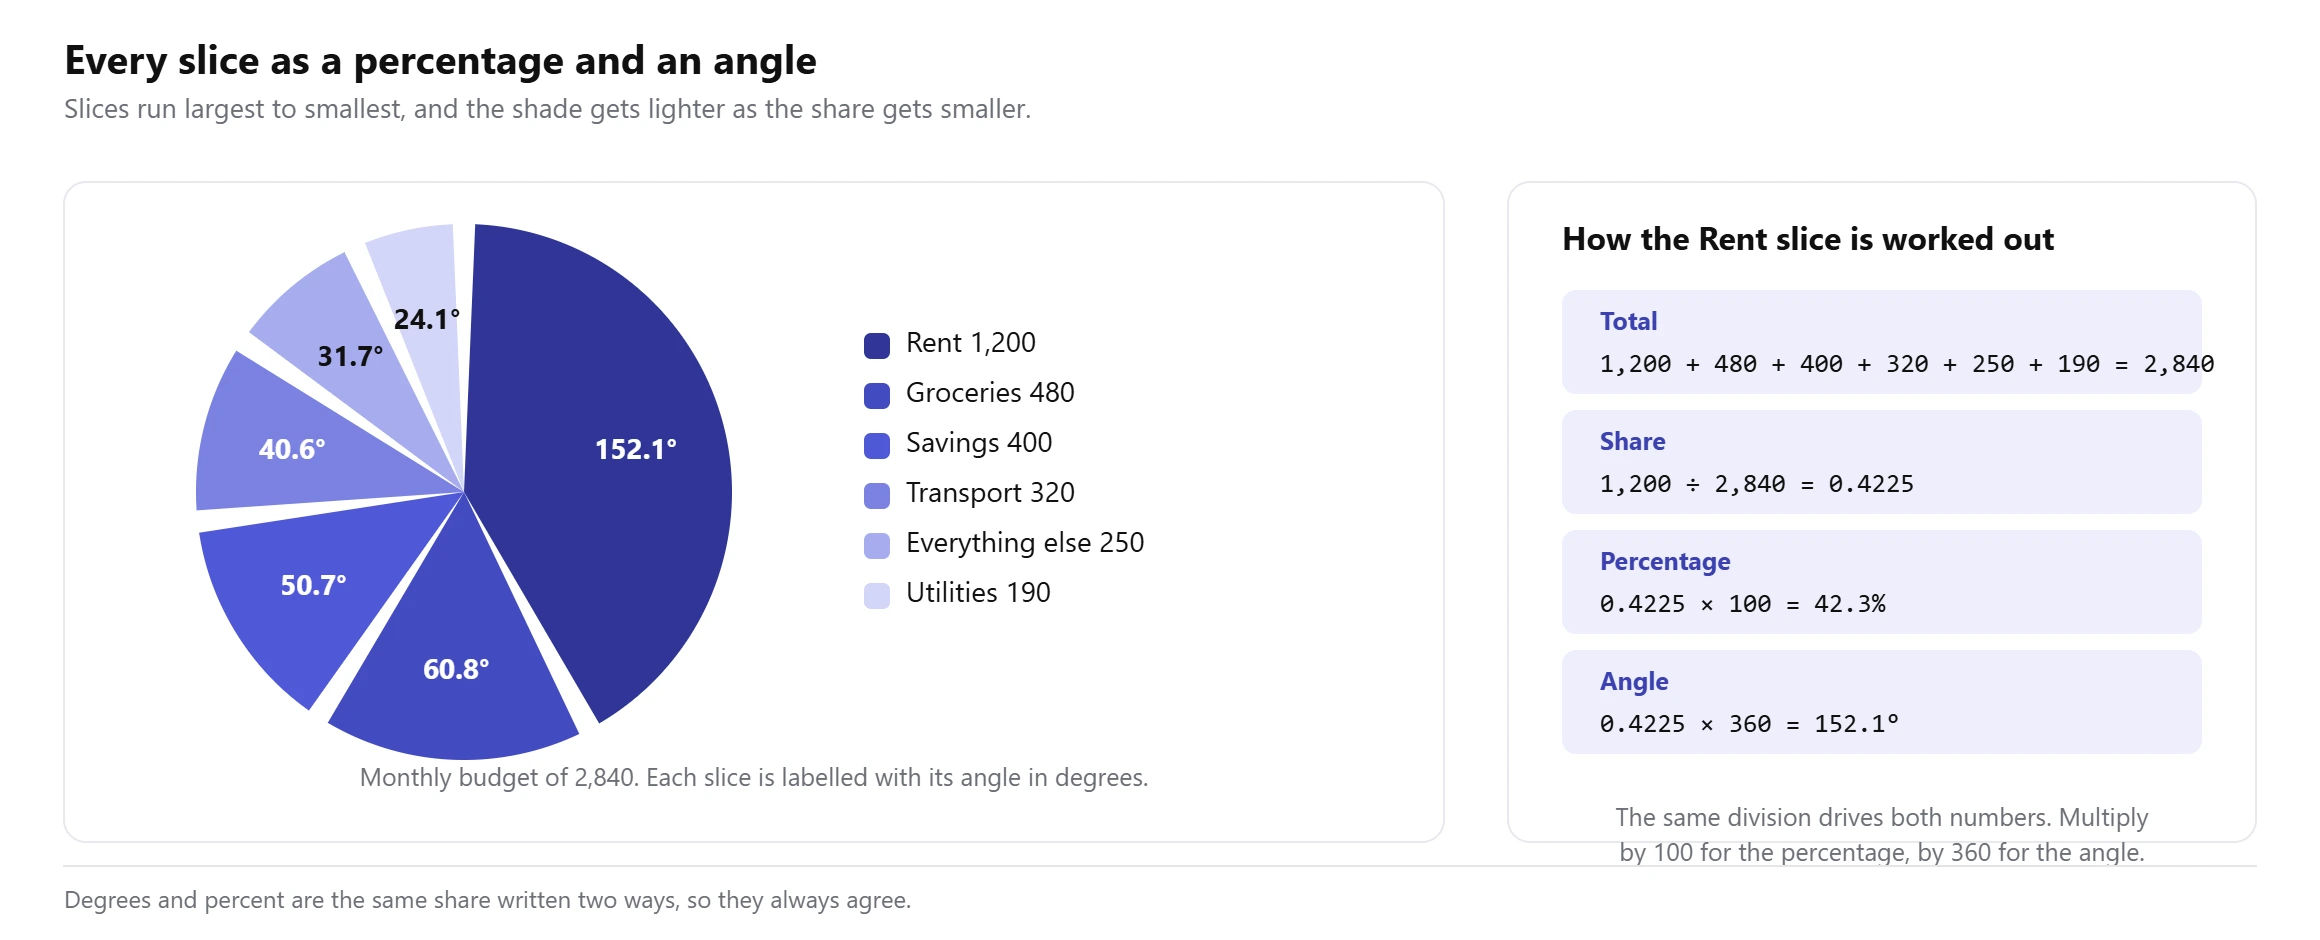
The angle is the one most homework questions are really after, because you cannot draw the chart without it. A protractor measures degrees, not percentages.
There is a shortcut worth knowing. Since 360 divided by 100 is 3.6, you can take any percentage and multiply it by 3.6 to get its angle. 25% is 90 degrees. 10% is 36 degrees. 1% is 3.6 degrees. Working the other way, divide an angle by 3.6 to get its percentage.
Expect the rounding to bite. If you round every slice to one decimal place, the percentages might add to 100.1% and the angles to 359.9 degrees rather than exactly 100 and 360. That is normal, and in an exam it is better to write a line saying the figures are rounded than to fudge the last slice so the total looks tidy. The calculator above tells you when your figures do this and by how much. If you are turning several percentages into one overall figure, our average percentage calculator handles the weighting that trips most people up.
How to make a pie chart in Excel
Put your labels in one column and your values in the next, with no blank rows in between. Select both columns, then go to Insert and pick the pie icon. Microsoft’s own guide to adding a pie chart calls it Insert > Insert Pie or Doughnut Chart. Choose 2-D Pie and the chart appears on the sheet.
Excel does not show percentages by default, which catches most people out. To get them, right-click any slice, choose Add Data Labels, then right-click a label and choose Format Data Labels. Tick Percentage in the panel that opens, and untick Value if you only want the share.
Two things Excel will not give you. It rounds the percentages to whole numbers unless you change the number format, and it never shows the angle of a slice at all. If you need the degrees, paste the same two columns into the calculator above.
How to make a pie chart in Google Sheets
Same shape of data, two columns side by side. Select them, then Insert and Chart. Sheets guesses a chart type, and it guesses wrong often enough that you should check: open the Chart editor on the right, go to Setup, and set Chart type to Pie chart.
For percentages, switch the Chart editor to Customise, open the Pie chart section, and set Slice label to Percentage. The same section has Doughnut hole if you want a donut instead of a pie.
Sheets is quicker than Excel for this, and the chart updates live as you edit the numbers. What it shares with Excel is the missing piece: no degrees anywhere.
Pie chart examples
Four cases where a pie earns its place, and what each one looks like in numbers.
A monthly budget
Six categories adding to 2,840. Rent takes 42.3% and 152.1 degrees, exactly as much as Groceries, Savings and Transport put together. This is the classic pie: one clear leader, a handful of categories, and a total that genuinely means something.
Market share
Three slices, 71, 27 and 2. That is 255.6 degrees, 97.2 degrees and 7.2 degrees. With only three parts and one of them dominant, the shape tells the whole story before anyone reads a label.
Survey answers
Five answers from 200 responses: 88 agree, 42 strongly agree, 35 neutral, 21 disagree, 14 strongly disagree. Agree alone is 44%. Add strongly agree and 65% of people are on side, which is the number that ends up in the summary.
Hours in a day
A total everyone already knows. Sleep 8, work 8, screen time 3, meals 2, commute 1, everything else 2. Each hour is exactly 15 degrees, because 360 divided by 24 is 15, which makes this the easiest pie chart to sanity-check by eye.
Pie chart vs bar chart vs donut chart
All three can show the same numbers. They are not equally good at the same job.
| Chart | Good at | Bad at | Use when |
|---|---|---|---|
| Pie | One part against the whole, at a glance | Comparing slices of similar size | Two to six parts, one of them clearly biggest |
| Donut | The same, with the total printed in the hole | The same, slightly worse for tiny slices | You want the total on the chart itself |
| Bar | Ranking and comparing any two values | Showing that the parts make a whole | More than six parts, or values that are close |
A donut is a pie with the middle removed. The slices are the same angles, so nothing about the maths changes. What you gain is a hole to print the total in, and what you lose is a little accuracy on the smallest slices, because the eye judges a thin ring worse than it judges a full wedge.
If your data is a distribution of measurements rather than a set of named categories, neither of these is the chart you want. That job belongs to a histogram, which puts your values into bins along a number line.
When a pie chart is the wrong choice
Most pie chart guides skip this part. It is the part that decides whether your chart is any use.
People are measurably bad at judging angles. Cleveland and McGill tested this directly in Graphical Perception, published in the Journal of the American Statistical Association in 1984. Comparing pie charts against bar charts on the same data, they found position judgements were 1.96 times as accurate as angle judgements. Readers are roughly twice as good at reading a bar as reading a slice.
That does not make pie charts useless. It makes them a chart for one specific job, and wrong for four situations.
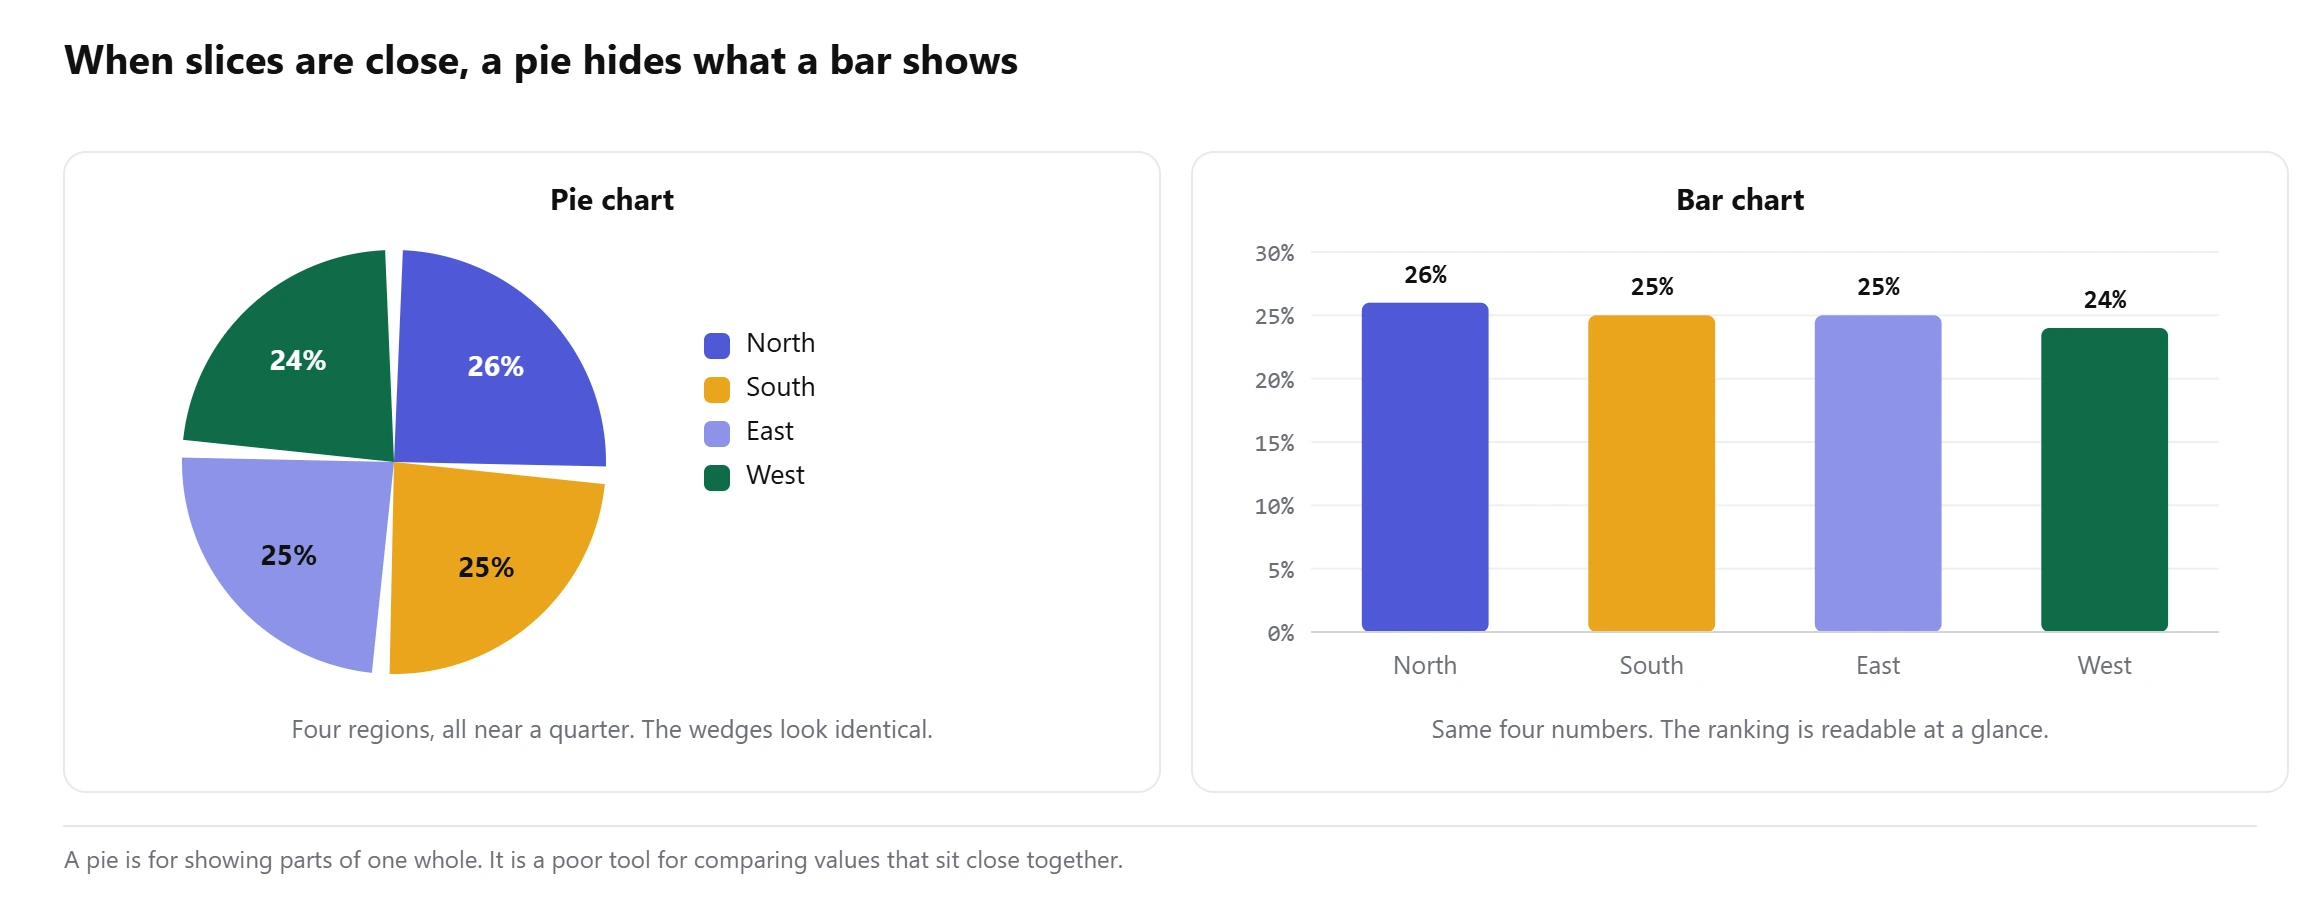
- Your slices are close in size. Two slices a percentage point apart are the same wedge to the eye. If the comparison between them is the point of the chart, use a bar chart or print the numbers.
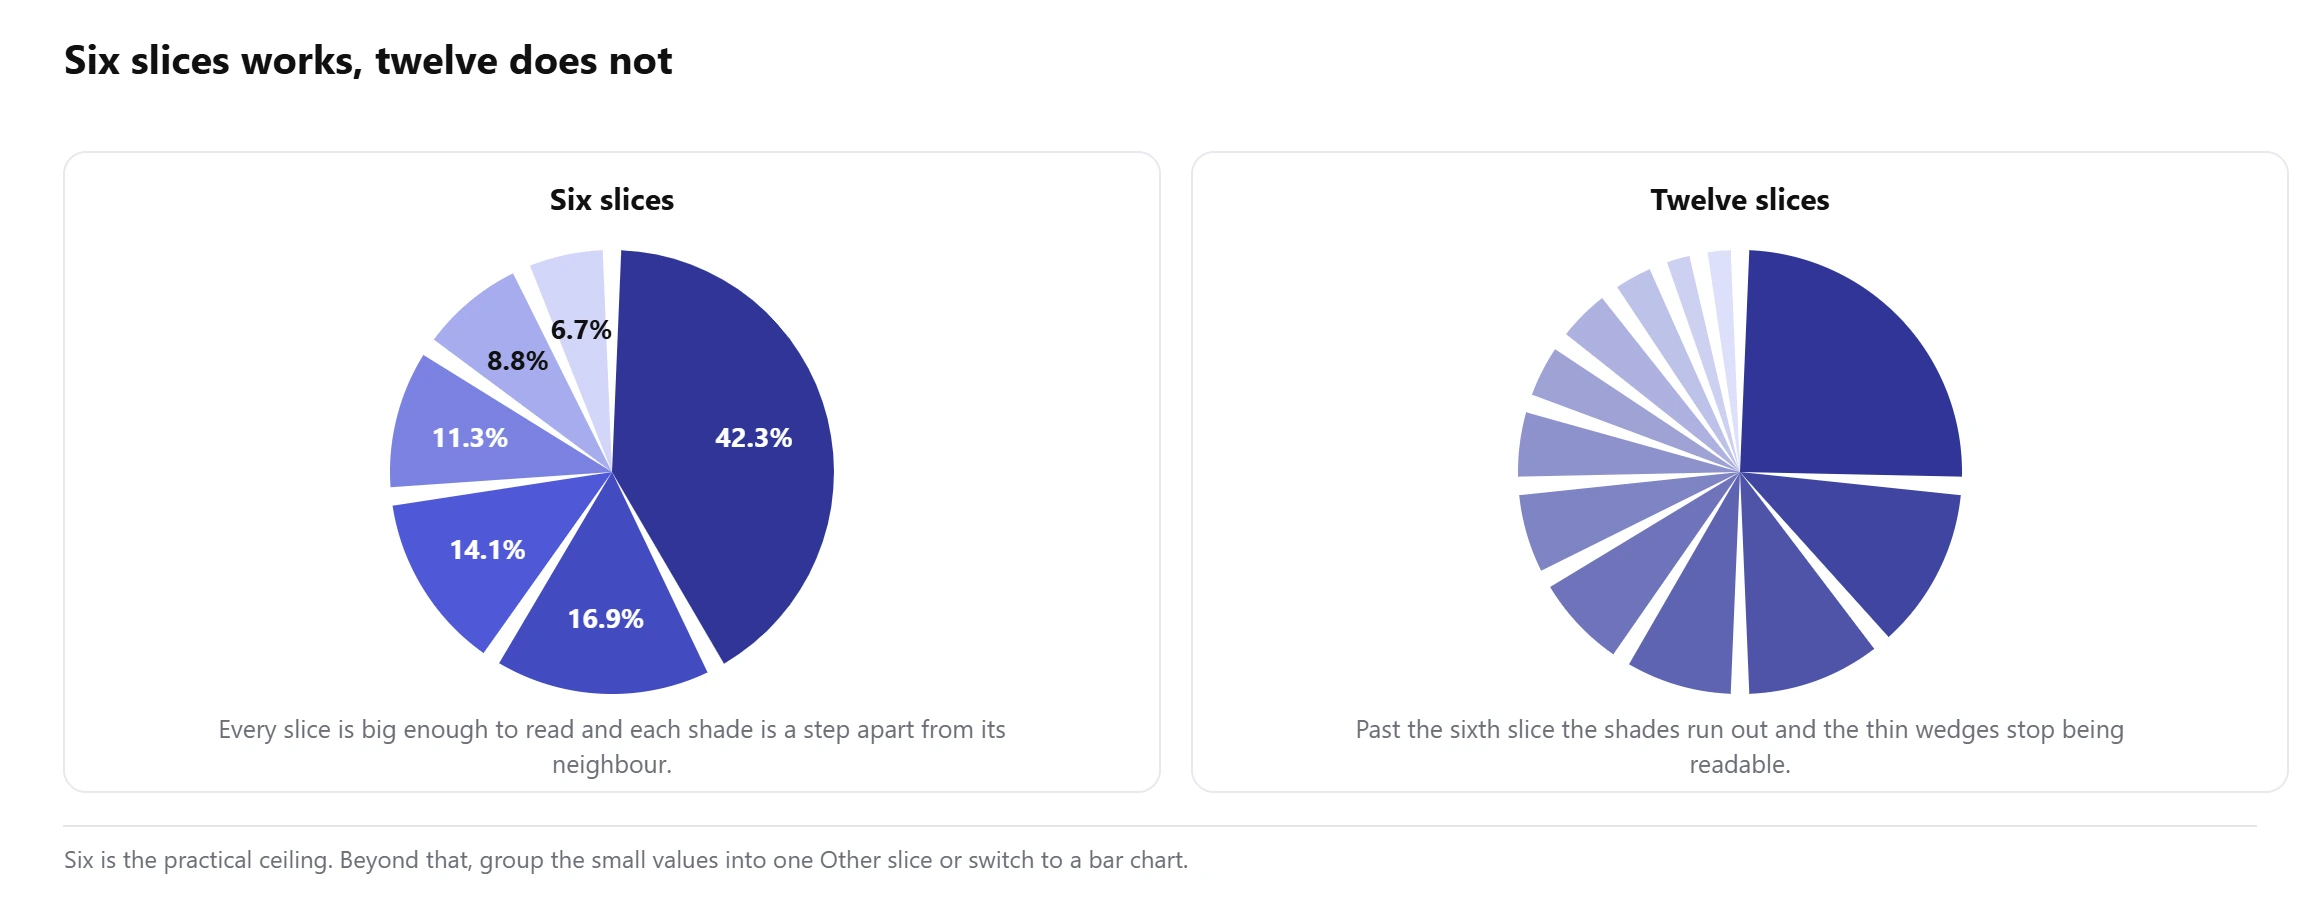
- You have more than about six categories. Past six, neighbouring slices get thin and the colours start running together. Group the small ones into an “Other” slice, which the calculator above will do in one click.
- Your parts do not make a whole. Five separate measurements that happen to be numbers are not shares of anything. The circle implies a total that does not exist. Report figures like that with a mean, median and range instead.
- You want to show change over time. Two pies side by side is a hard way to see that something went from 30% to 34%. A line or a bar shows it immediately.
The honest test is simple. If the reader has to compare two slices to get your point, pick a different chart. If the point is that one slice is most of the circle, a pie says it faster than anything else.
Why use this pie chart maker?
What you get with this free pie chart maker:
- The angle in degrees for every slice, which no other online pie chart tool prints and every protractor needs.
- Percentage, value, angle and a running cumulative total in one table you can copy straight into your working.
- Paste two columns from Excel or Google Sheets as they are, or type rows by hand in the table tab.
- A warning when two slices are too close to tell apart, or when you have more slices than a pie can carry.
- One click to group the small slices into “Other” when the chart gets crowded.
- Colours chosen to stay distinguishable for colour-blind readers, and a donut switch with the total in the middle.
- Download as PNG for a report or SVG if you want to edit the chart later.
- Free to use
- No sign-up
- Percentages and degrees
- PNG and SVG download
- Pie or donut
Frequently asked questions
How do I make a pie chart?
Paste your labels and values into the box above, one pair per line, and press Make pie chart. The calculator adds up the total, works out each slice as a percentage and an angle, and draws the chart. You can then switch to a donut, change the colours and download it.
How do you calculate the angle of a pie chart slice?
Divide the value by the total and multiply by 360. A category worth 1,200 out of 2,840 gives 1,200 divided by 2,840 times 360, which is 152.1 degrees. A quicker route if you already have the percentage: multiply it by 3.6.
How do I turn a pie chart percentage back into a value?
Multiply the percentage by the total and divide by 100. If a slice is 15% of a total of 2,840, the value is 426. Working from an angle instead, divide the angle by 360 and multiply by the total.
Why do my percentages add up to 100.1%?
Rounding. Each slice is rounded on its own, and those small roundings can push the total slightly off 100. It is normal and worth stating rather than hiding. Increasing the decimal places above usually makes it go away.
How many slices should a pie chart have?
Two to six. Past about six the slices get thin, the colours get harder to tell apart, and readers stop being able to compare them. Group the smallest categories into an “Other” slice instead.
Can a pie chart show negative numbers?
No. A slice is a share of a whole, and nothing can take up less than none of a circle. If your data has negatives, such as profit and loss by department, use a bar chart with bars going both ways from zero.
What is the difference between a pie chart and a donut chart?
Only the hole. The slices sit at the same angles and mean the same thing. The hole gives you somewhere to print the total, at the cost of making the smallest slices slightly harder to judge.
Can I download the pie chart?
Yes. PNG saves an image at twice the display size for reports and slides, and SVG saves a vector file you can open in any design tool and keep editing.
Explore our other calculators
 Average calculator
 Average percentage calculator
 Average time calculator
 Degrees of freedom calculator
 Exponential Regression Calculator
 Five Number Summary Calculator
 Histogram maker
 IQR calculator
 Linear regression calculator
 Mean, Median, Mode and Range Calculator
 Outlier Calculator
 Probability Calculator
 Standard deviation calculator
 Sum of Squares Calculator
 Variance calculator
 Weighted average calculator
Our latest blogs
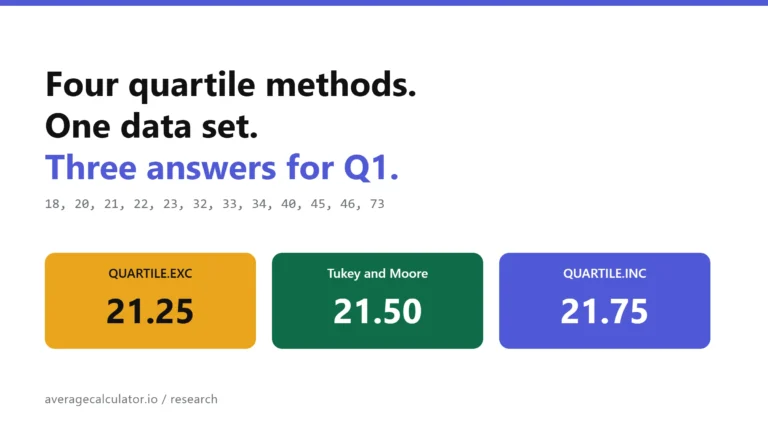
Four quartile methods, one data set, three answers for Q1
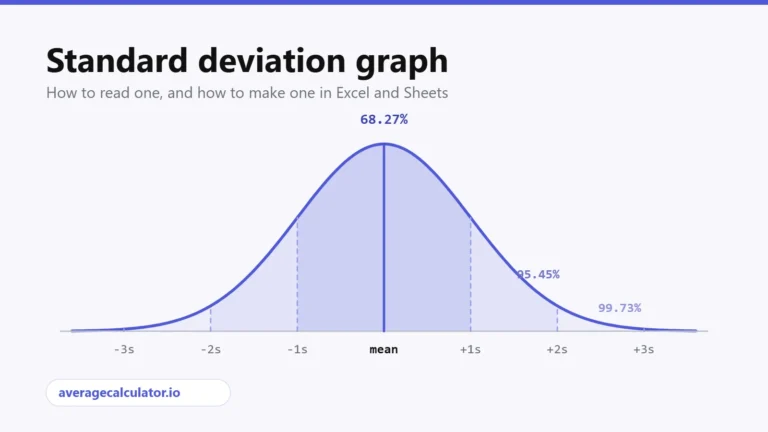
Standard deviation graph: how to read one and how to make one
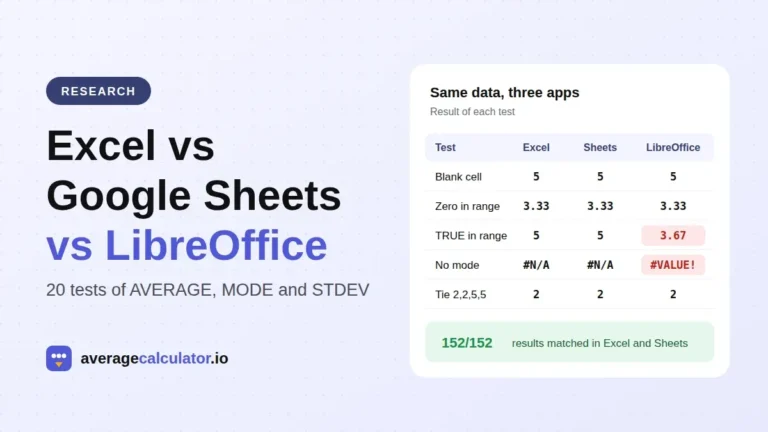
Excel vs Google Sheets vs LibreOffice: how average functions handle blanks, zeros and text
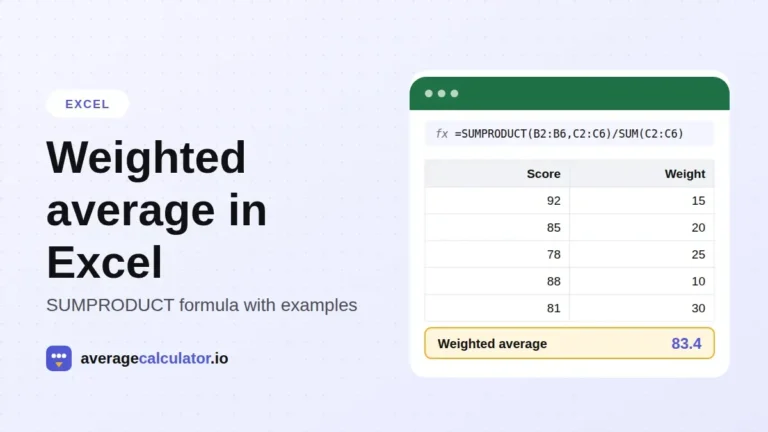
How to calculate a weighted average in Excel, with examples
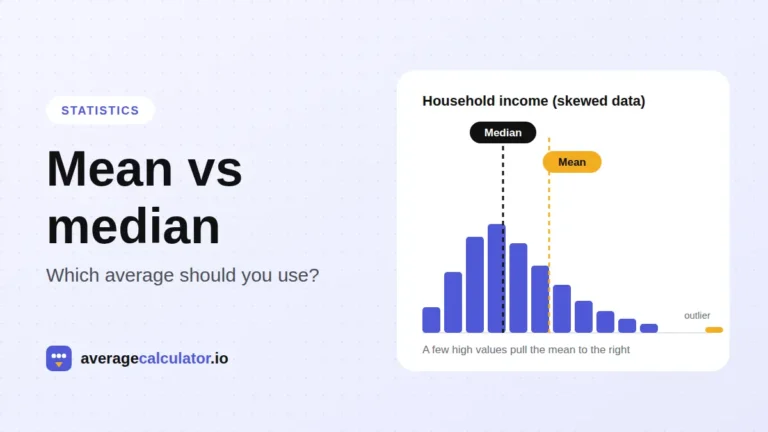
Mean vs median: which average should you use?
Who made this calculator
Spotted a mistake in this calculator? Tell us the numbers you used and what you expected, and we will check it.
Report an error