
Outlier calculator
Paste your data and every value gets tested four ways: the 1.5 x IQR rule, the z-score, the modified z-score built on the MAD, and Grubbs' test with a real p value. You get the fences, the flagged values, a cleaned list to copy and the full working.

 By Miriam Ong Ante · Reviewed by Danielle Valentine✓ Fact-checked
How to use the outlier calculator
- 1Paste your numbers
Commas, spaces, tabs or one per line all work, so a column copied out of Excel or Google Sheets goes straight in.
- 2Press Find outliers
Four tests run at once: the 1.5 IQR rule, the z-score rule, the modified z-score built on the median, and Grubbs' test with a real p value.
- 3Read where they disagree
They often do. One extreme value inflates the standard deviation that the plain z-score is measured against, so the z-score rule is the one that misses things.
- 4Take the cleaned list if you want it
The calculator prints your data with the flagged values removed, ready to copy. Look at what you are removing first.
How each test was worked out
What counts as an outlier
An outlier is a value that sits far enough from the rest of the data that it looks like it came from somewhere else. That is the whole definition, and it is deliberately vague, because "far enough" is a judgement call that different rules answer differently.
Statistics turns the judgement into arithmetic. Outlier tests identify outliers by drawing a boundary and calling anything past it an outlier. The 1.5 IQR rule puts the boundary a fixed distance outside the middle half of the data. The z-score method puts it a fixed number of standard deviations from the mean. Grubbs' test asks something different: how unlikely is the most extreme value if every reading really did come from the same normal distribution.
None of them tells you the value is wrong. A flagged point can be a typo, a broken sensor, a different population that crept into the sample, or the single most interesting thing in your data. The test tells you where to look.
How to find outliers, and why the four tests disagree
There is no single answer to how to find outliers, because the four standard methods do not always reach the same verdict. Run all four on the same twelve numbers and you can get three different answers. Here is 3, 41, 44, 45, 47, 48, 49, 51, 52, 55, 58, 96.
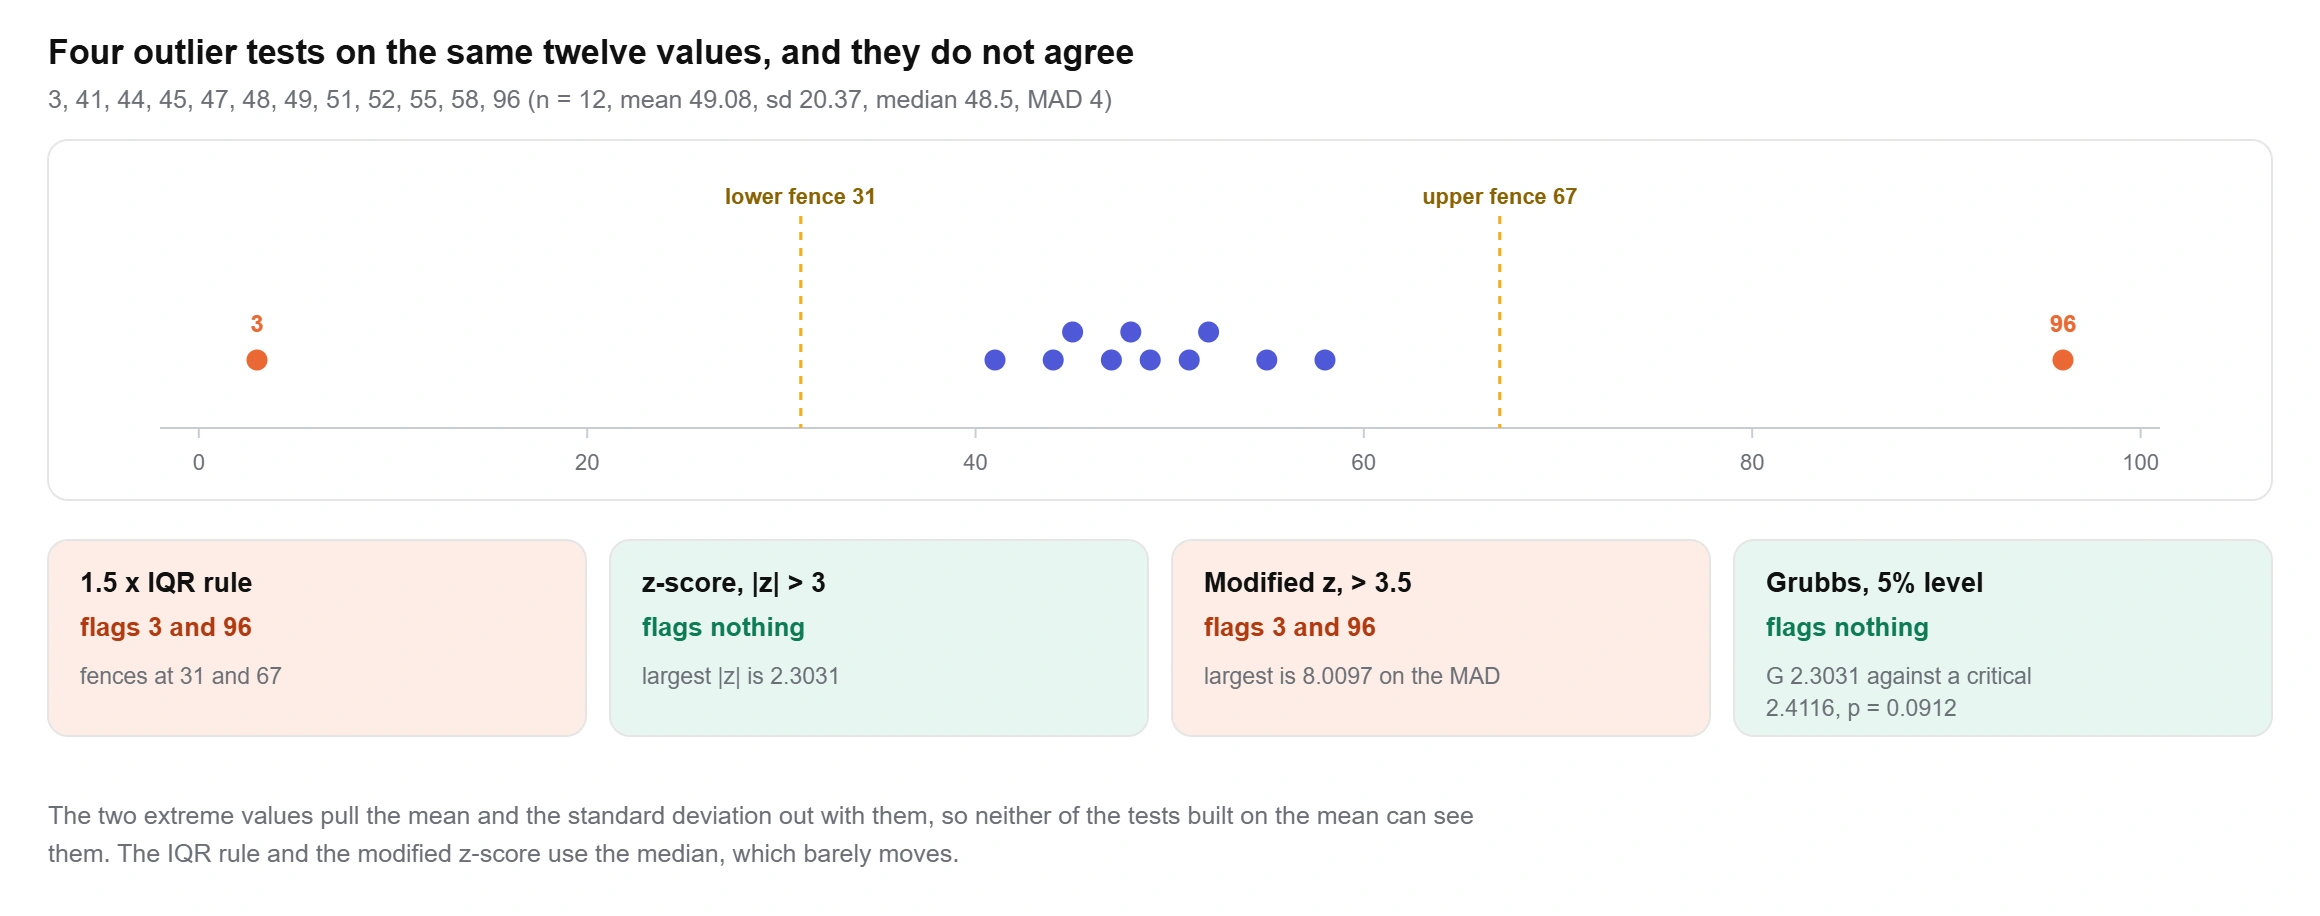
The split is not random. The IQR rule and the modified z-score are built on the median and the quartiles, which barely move when you add an extreme value. The plain z-score and Grubbs' test are built on the mean and the standard deviation, and 3 and 96 drag both of those out with them. The standard deviation here is 20.37. Take the two extremes out and it falls to 5.16.
So the practical answer to how to calculate outliers is to run more than one outlier test and read the disagreement, rather than trusting whichever rule your course happened to teach. The calculator above runs all four at once for exactly this reason.
The outlier formula most courses mean: the 1.5 IQR rule
When a textbook says "the outlier formula" without qualifying it, this is almost always the one. The 1.5 IQR rule, also written 1.5 x IQR, works like this: find the quartiles, subtract to get the interquartile range, then step 1.5 interquartile ranges out from each end of the box.
lower fence = Q1 − 1.5 × IQR
upper fence = Q3 + 1.5 × IQR
anything below the lower fence or above the upper fence is an outlier
Take ten reaction times in milliseconds: 12, 13, 13, 14, 15, 15, 16, 17, 18, 44. The five number summary gives Q1 = 13 and Q3 = 17, so the IQR is 4.
IQR = 17 − 13 = 4
lower fence = 13 − 1.5 × 4 = 7
upper fence = 17 + 1.5 × 4 = 23
44 is above 23, so 44 is an outlier
The 1.5 is a convention, not a derivation. John Tukey picked it because it works, and the number it produces is reasonable: on data that really is normal, the 1.5 x IQR rule flags about 0.70 percent of values, roughly one in every 143. Push the multiplier to 3 and that drops to about 2 in a million, which is why 3 x IQR is sometimes called the fence for extreme outliers. The calculator lets you switch between 1.5, 2.2 and 3.
One thing to watch. Your Q1 and Q3 depend on which quartile definition you use, and there are several in circulation. A TI-84 leaves the middle value out of both halves, Excel interpolates a position instead, and on a small dataset the two can put the fence in a different place and change whether a point is flagged at all, which happened in 18 percent of the 200,000 samples we tested. This calculator uses the median-excluded method, which is what most statistics courses teach.
Finding outliers with standard deviation, and where it breaks
The z-score method counts how many standard deviations each value sits from the mean, then flags anything past a threshold. Three is the usual threshold, two and two and a half also turn up.
z = (value − mean) ÷ standard deviation
flag the value if |z| is greater than 3
On the reaction times, the mean is 17.7 and the standard deviation is 9.4287. The 44 gives z = (44 − 17.7) ÷ 9.4287 = 2.7894, which is under 3. The IQR rule flagged it. The z-score rule does not.
That is not bad luck. With ten values, no point can possibly reach a |z| of 3. The largest absolute z-score any single value can take in a sample of size n is fixed by the arithmetic:
largest possible |z| = (n − 1) ÷ √n
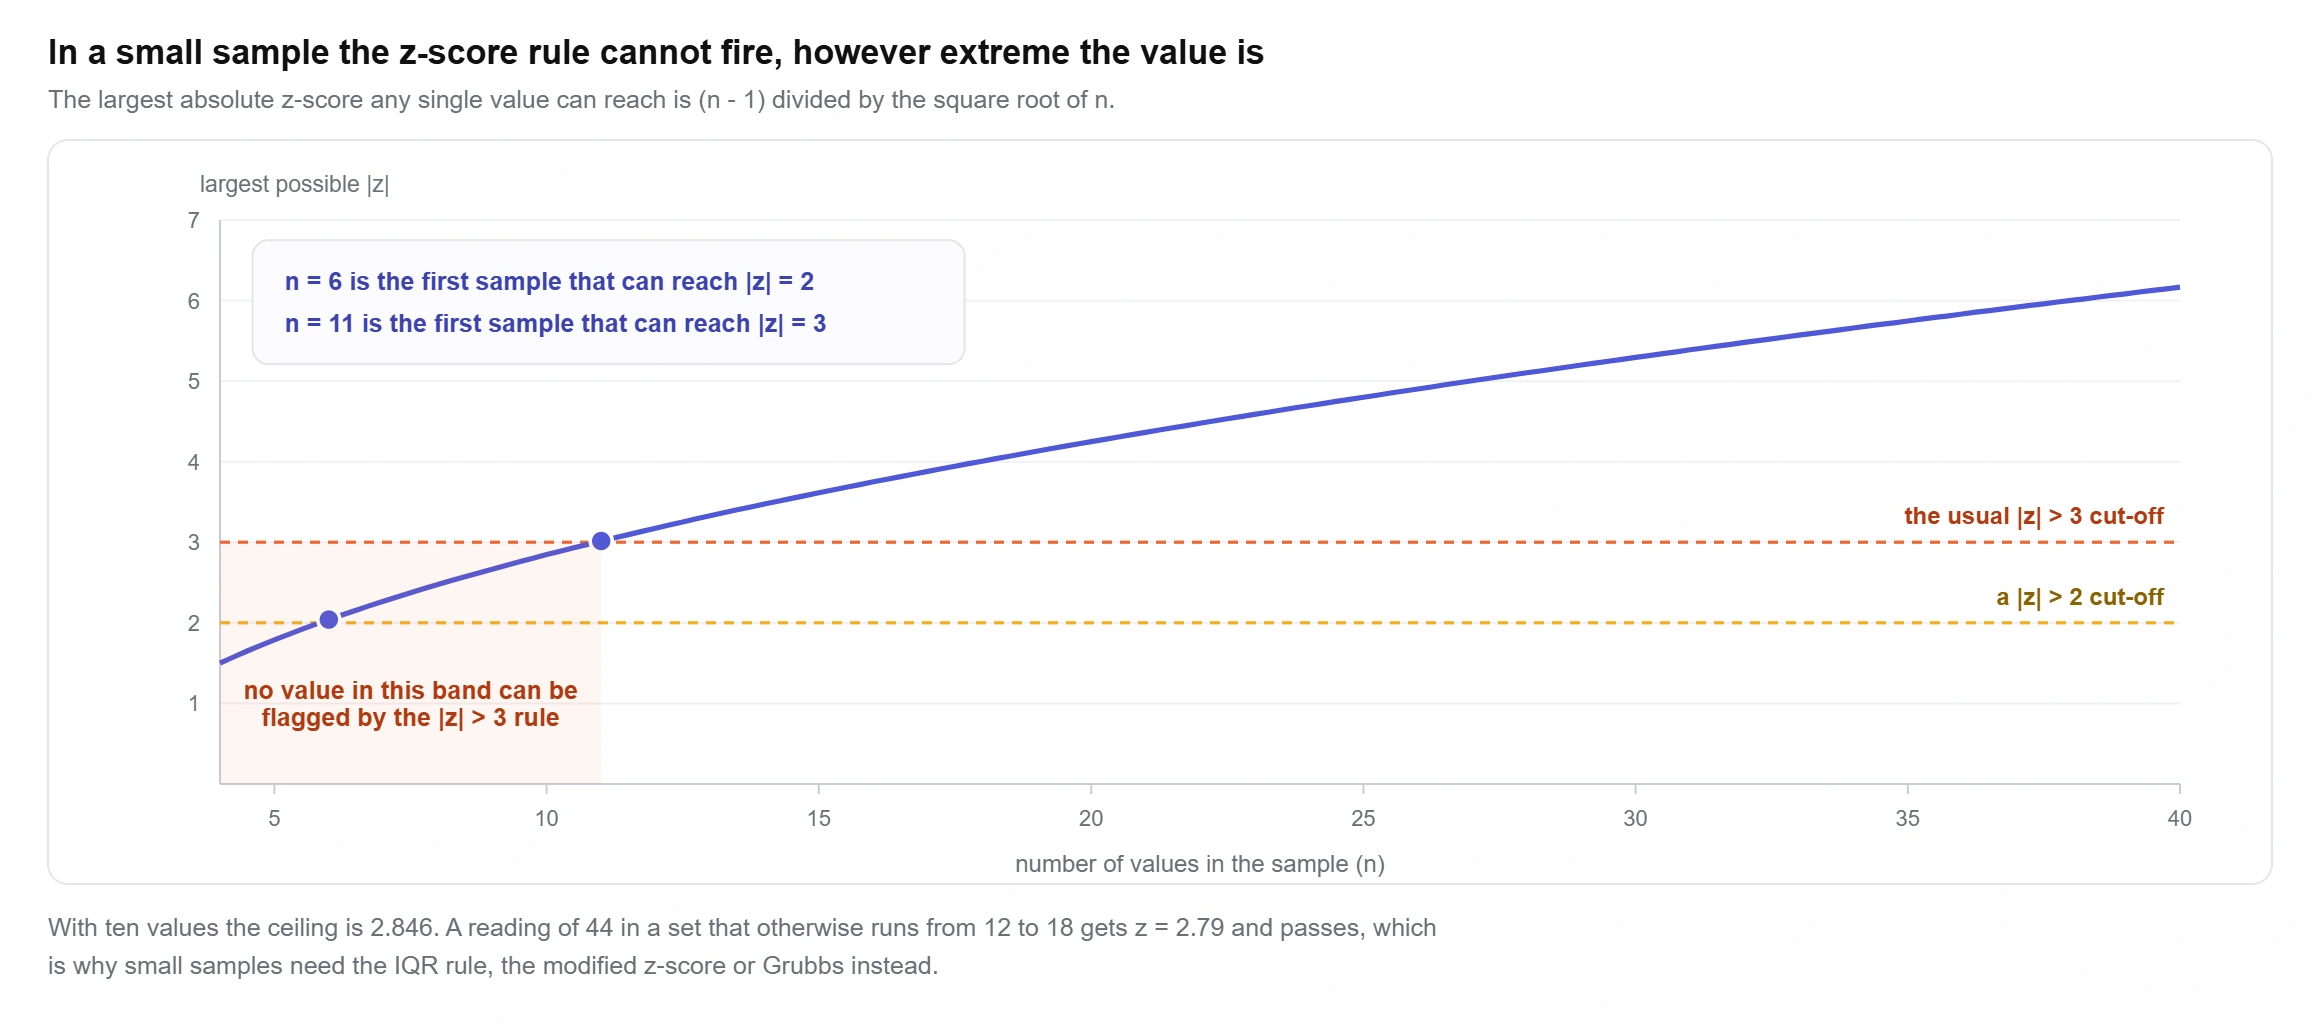
For n = 10 that ceiling is 2.846. You could replace the 44 with 44,000 and the z-score would still come out below 3, because the extreme value is part of the standard deviation it is being measured against. The rule only becomes capable of firing at n = 11.
This is the single most common reason a homework answer and a software answer disagree. If your sample is small, use the IQR rule, the modified z-score or Grubbs' test. The plain z-score method is for larger samples.
The modified z-score, built on the median and the MAD
The modified z-score keeps the shape of the z-score and swaps out the two parts that the outlier can corrupt. The median replaces the mean, and the median absolute deviation replaces the standard deviation. The MAD is the median of the distances from the median, which sounds circular but is easy to compute.
MAD = median of |value − median|
modified z = 0.6745 × (value − median) ÷ MAD
flag the value if the result is beyond 3.5
The 0.6745 is there so the number can be read on the same scale as an ordinary z-score. On a normal distribution the MAD is about 0.6745 standard deviations, so multiplying by it puts the two measures side by side. Boris Iglewicz and David Hoaglin proposed the 3.5 threshold in their 1993 ASQC volume on detecting outliers, and it has stuck.
Back to the reaction times. The median is 15 and the MAD is 2, so the 44 scores 0.6745 × (44 − 15) ÷ 2 = 9.7803. The plain z-score called it 2.7894 and let it through. The modified z-score calls it 9.78 and flags it hard. Same value, same data, and the difference is entirely down to which centre and which spread you built the test on.
One limitation: if more than half your values are identical the MAD is zero and the formula divides by zero. The calculator detects this and tells you rather than printing infinity.
Grubbs' test for outliers
The IQR rule and the z-score draw a line and see what falls outside it. Grubbs' test asks a proper statistical question instead: if every one of these readings came from the same normal distribution, how often would the most extreme one be this extreme? If the answer is "almost never", you have evidence of an outlier rather than an opinion about one.
The test statistic is just the largest absolute z-score in the sample.
G = max |value − mean| ÷ standard deviation
reject the value as an outlier if G is greater than the critical value for your n and significance level
The critical value comes from the t distribution and grows with the sample size, which is the part that makes Grubbs different from a fixed |z| cut-off. A G of 2.79 is unremarkable in a sample of fifty and strong evidence in a sample of ten.
Gcrit = ((n − 1) ÷ √n) × √(t² ÷ (n − 2 + t²))
where t is the t value at 1 − α/(2n) with n − 2 degrees of freedom
On the ten reaction times, G = 2.7894 against a 5 percent critical value of 2.290, and the p value works out at 0.000007. The 44 is flagged. Notice that the plain |z| > 3 rule let the same value through: Grubbs uses a threshold scaled to the sample size, so it does not suffer the small-sample ceiling problem described above. A p value is a probability, the chance of seeing a gap this large in clean data, and the probability calculator will turn a figure like that into a fraction or odds.
Grubbs test critical value table
Two-sided critical values, for the test that checks both tails at once. The calculator computes these from the t distribution for your exact n rather than rounding to the nearest table row.
| n | 5% | 1% | n | 5% | 1% |
|---|---|---|---|---|---|
| 3 | 1.154 | 1.155 | 20 | 2.708 | 3.001 |
| 4 | 1.481 | 1.496 | 21 | 2.734 | 3.031 |
| 5 | 1.715 | 1.764 | 22 | 2.758 | 3.060 |
| 6 | 1.887 | 1.973 | 23 | 2.780 | 3.087 |
| 7 | 2.020 | 2.139 | 24 | 2.802 | 3.112 |
| 8 | 2.127 | 2.274 | 25 | 2.822 | 3.135 |
| 9 | 2.215 | 2.387 | 26 | 2.841 | 3.158 |
| 10 | 2.290 | 2.482 | 27 | 2.859 | 3.179 |
| 11 | 2.355 | 2.564 | 28 | 2.876 | 3.199 |
| 12 | 2.412 | 2.636 | 29 | 2.893 | 3.218 |
| 13 | 2.462 | 2.699 | 30 | 2.908 | 3.236 |
| 14 | 2.507 | 2.755 | 35 | 2.978 | 3.316 |
| 15 | 2.548 | 2.806 | 40 | 3.036 | 3.381 |
| 16 | 2.586 | 2.852 | 50 | 3.128 | 3.482 |
| 17 | 2.620 | 2.894 | 60 | 3.200 | 3.560 |
| 18 | 2.652 | 2.932 | 80 | 3.306 | 3.673 |
| 19 | 2.681 | 2.968 | 100 | 3.384 | 3.754 |
Two things the test will not do for you. It only examines one value per run, so a dataset with two odd points needs care, which the next section covers. And it assumes the rest of the data is roughly normal, so on strongly skewed data a perfectly ordinary large value can be flagged. Income, waiting times and counts are all skewed by nature. Plot the data before you trust a significance test on it.
Dixon's Q test answers a similar question for very small samples, usually three to about thirty readings, and is common in analytical chemistry. It relies on published critical value tables rather than a closed formula, so this calculator does not include it. If your lab protocol asks for Dixon specifically, use the table your method prescribes.
Masking: when two outliers hide each other
Masking is the failure mode nobody warns you about, and it is the reason a clean test result can be worthless. Two extreme values at opposite ends inflate the standard deviation so much that neither of them looks far from the mean any more. The test comes back empty and you conclude the data is fine.
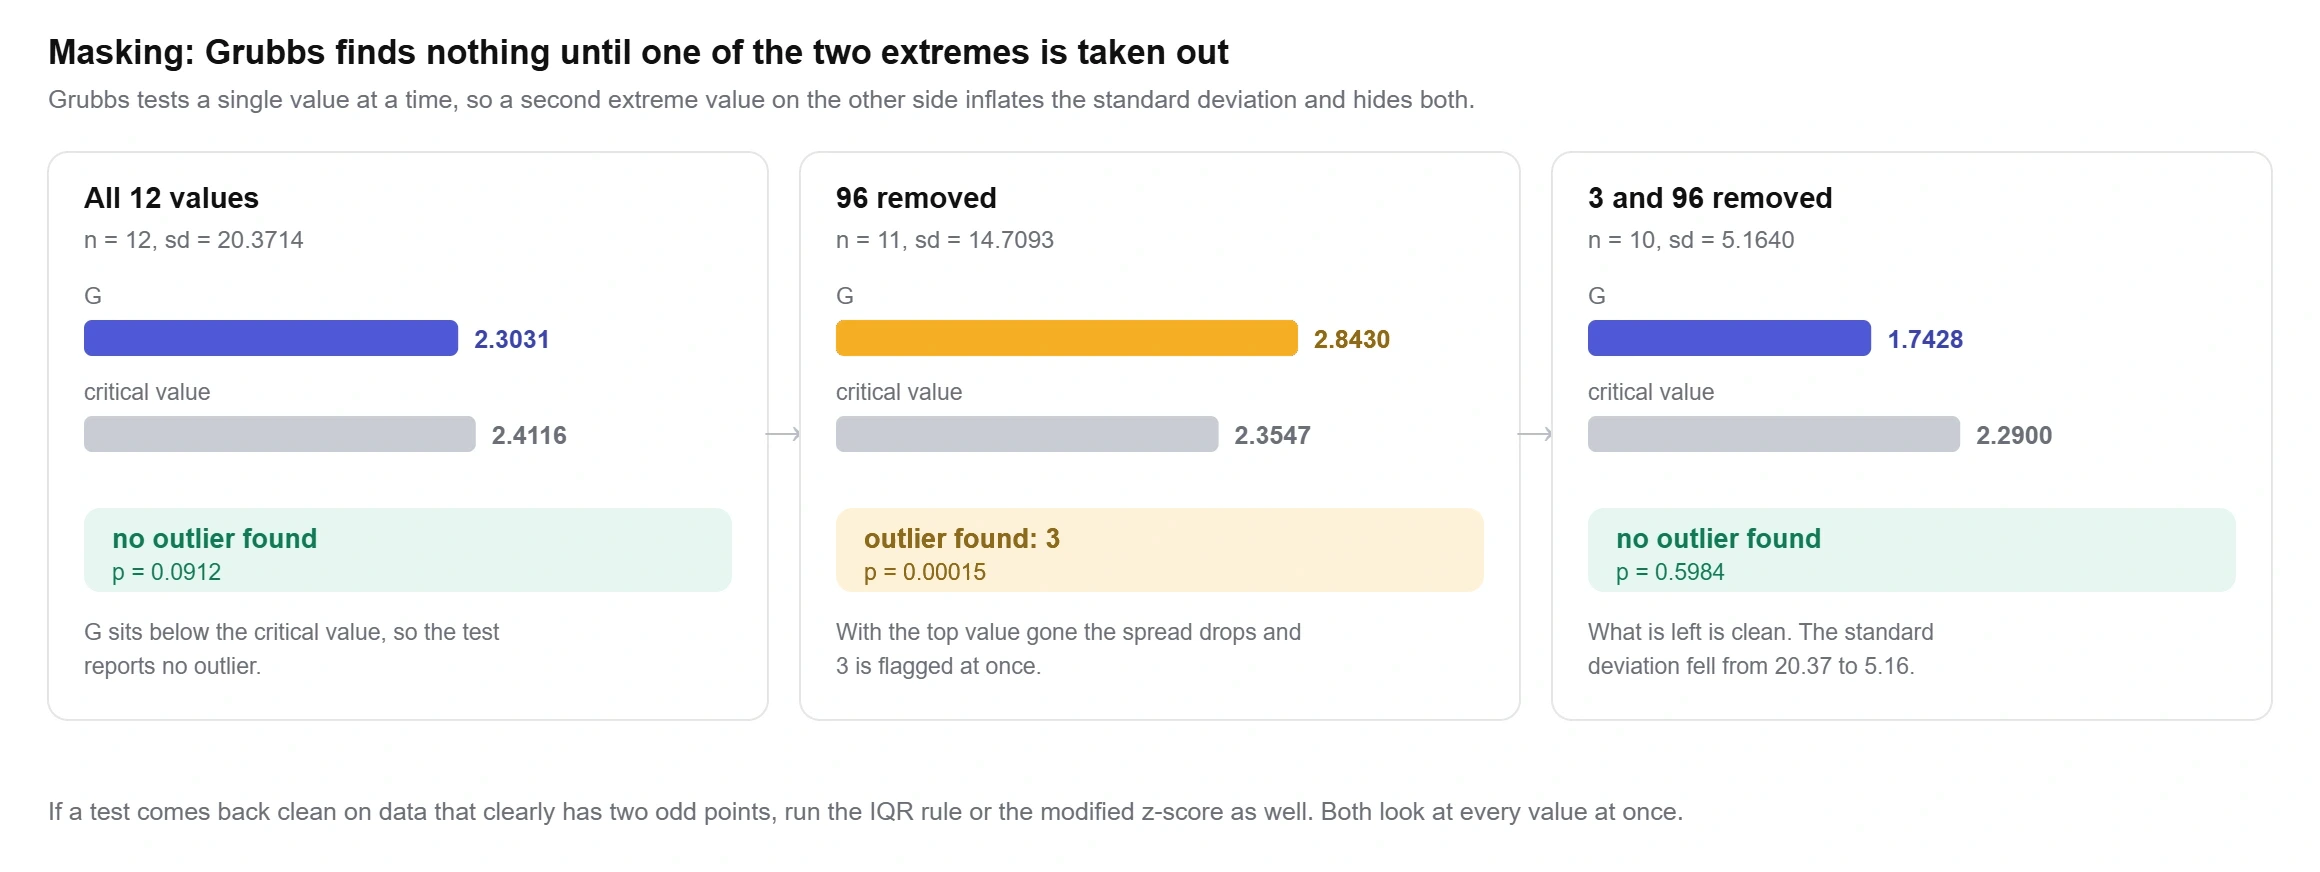
Run Grubbs on all twelve of those values and G = 2.3031 against a critical value of 2.4116, p = 0.0912. No outlier. Delete the 96, run it again on the remaining eleven, and the 3 comes back with G = 2.8430 against 2.3547 and p = 0.00015. Nothing about the 3 changed. The only thing that changed is what it was being compared against.
Two defences. Run a test that looks at every value at once, which the IQR rule and the modified z-score both do, and both of them caught 3 and 96 on the first pass. Or run Grubbs iteratively: remove the flagged value, rerun, and stop when the test comes back clean. The iterative route needs care, because each round tests a smaller sample and the significance level no longer means quite what it did at the start.
Should you remove an outlier?
Usually not, and the fact that a test flagged it is not a reason on its own. Deleting inconvenient data is how you end up with a tidy analysis that is wrong.
Remove a point when you can name what went wrong with it. A value of 250 in a column of adult heights in centimetres, a blood pressure of 0, a survey response of 999 that was the code for "no answer", a sensor reading logged while the instrument was being recalibrated. These are data errors and they belong out of the analysis, with a note saying how many you dropped and why.
Keep the point when it is simply large. Extreme values are what heavy-tailed distributions produce, and in income data, insurance claims, file sizes and time-to-failure they are the part of the data that matters most. If you delete them you are describing a population that does not exist.
When you are not sure, report both. Run the analysis with and without the point and say what changed. If the conclusion survives, the outlier was never the issue. If it flips, that is worth knowing and worth stating. The calculator gives you a cleaned list to copy so you can do the second run in a few seconds, and the alternatives are worth a look too: the median and the IQR are barely affected by extreme values, so a summary built on them often needs no cleaning at all.
Finding outliers in Excel, Sheets, R and Python
Neither Excel nor Google Sheets has an outlier function. You build the fences from the quartiles and flag with an IF.
F1: =QUARTILE.INC(A2:A50,1)
F2: =QUARTILE.INC(A2:A50,3)
F3: =F2−F1
F4: =F1−1.5*F3 F5: =F2+1.5*F3
B2: =IF(OR(A2<$F$4,A2>$F$5),"outlier","")
QUARTILE.INC interpolates quartile positions, which is not the method a TI-84 uses, so on a small sheet your fences can land somewhere slightly different from the ones in your textbook. QUARTILE.EXC uses the other interpolation convention and will give you a third answer. Neither program has a built-in Grubbs test; the Real Statistics add-in adds one to Excel.
In R, boxplot.stats(x)$out returns the values beyond the whiskers. It uses Tukey hinges rather than interpolated quartiles, so it can disagree with Excel by a fraction on small vectors. For the significance test, grubbs.test(x) from the outliers package gives G and a p value.
In Python, q1, q3 = np.percentile(x, [25, 75]) gives you the interpolated quartiles and the fences follow. SciPy has no Grubbs function, so compute G as the largest absolute z-score and compare it against the critical value built from scipy.stats.t.ppf(1 - alpha/(2*n), n-2), which is exactly what the calculator on this page does.
On a TI-84, run 1-Var Stats to get Q1 and Q3, then do the fence arithmetic by hand. The calculator will not flag outliers for you, although a MATH PLOT boxplot with the second icon selected draws them as separate dots.
Where outlier questions go wrong
Using the range instead of the IQR. The fences are built from Q3 − Q1, the width of the middle half. Maximum minus minimum is the range, and putting it in the formula gives fences so wide that nothing is ever flagged.
Comparing the fence to the wrong quartile. The lower fence is subtracted from Q1 and the upper fence is added to Q3. Swapping them produces a lower fence above the upper fence, which is a good sign you have mixed up a sign somewhere.
Applying |z| > 3 to eight data points. Covered above, and worth repeating because it is so common. Under eleven values the rule cannot fire.
Reporting the fence as the outlier. The answer to "find the outlier" is the data value, 44, not the boundary it crossed, 23.
Assuming one test settles it. No single outlier test can determine outliers on its own in every situation. A value can fail the IQR rule and pass Grubbs, or the reverse. When they disagree, say which test you used and on what grounds, rather than quietly picking the one that gives the answer you wanted.
Treating a skewed distribution as if it were normal. On right-skewed data the 1.5 x IQR rule flags far more than 0.7 percent of values, and none of them are errors. Look at the shape first, with a histogram or a box plot, before you decide anything is anomalous.
Why use this outlier calculator?
What you get with this free outlier calculator:
- Four tests on one screen: the IQR rule, the z-score, the modified z-score and Grubbs, with a comparison table that shows exactly where they part company.
- Grubbs' test with a critical value computed for your exact sample size and a real p value, not a lookup rounded to the nearest table row.
- A warning when the |z| rule cannot physically fire on a sample your size, and a masking warning when the tests disagree.
- Adjustable thresholds: 1.5, 2.2 or 3 for the IQR multiplier, 2, 2.5 or 3 for the z-score, 5 or 1 percent for Grubbs.
- A dot plot with the fences drawn on it, or a box plot, either one downloadable as a PNG.
- Your data with the flagged values removed, ready to copy back into a sheet.
- Every step written out with your own numbers in it, including the fence arithmetic and the Grubbs comparison.
- Free to use
- No sign-up
- Four outlier tests
- Grubbs p value
- Step by step working
Frequently asked questions
What is the formula for finding outliers?
The standard one is the 1.5 x IQR rule: lower fence = Q1 − 1.5 × IQR and upper fence = Q3 + 1.5 × IQR, where IQR = Q3 − Q1. Any value outside those two numbers is an outlier. The other common outlier formula is the z-score, z = (value − mean) ÷ standard deviation, with a threshold of 3. The two do not always agree, so the calculator runs both and shows the difference.
How do you select the outlier in a data set?
Sort the values, work out Q1 and Q3, and calculate the two fences. The outlier is the data value that falls outside them, not the fence itself. If a question gives you five numbers and asks which one is the outlier, the arithmetic usually makes it obvious once the fences are down on paper. Paste the list above and the calculator prints the fences and names the value.
How do you find outliers using standard deviation?
Calculate the mean and the standard deviation, then convert each value to a z-score and flag anything with |z| above 3. Some courses use 2 or 2.5 instead. The method only works on reasonably large samples: with ten values the biggest z-score arithmetically possible is 2.846, so a |z| > 3 rule can never flag anything. Below eleven values, use the IQR rule or Grubbs' test.
What is Grubbs' test used for?
It tests whether the single most extreme value in a sample is too extreme to have come from the same normal distribution as the rest. You get a test statistic G, a critical value that depends on the sample size, and a p value. It is the standard test in analytical chemistry and quality work, where you need a defensible reason for discarding a measurement rather than a rule of thumb.
What is a modified z-score?
A z-score rebuilt on the median and the median absolute deviation instead of the mean and the standard deviation: 0.6745 × (value − median) ÷ MAD, with a threshold of 3.5. Because the median and the MAD hardly move when an extreme value is added, the modified z-score can spot outliers that the ordinary z-score hides.
Can a data set have more than one outlier?
Yes, and that is where tests start to fail. Two extremes at opposite ends inflate the standard deviation enough to hide each other, which is called masking. Grubbs' test only examines one value per run and is vulnerable to it. The IQR rule and the modified z-score check every value against a median-based boundary, so they handle multiple outliers better.
How do I find outliers in Excel?
There is no outlier function. Put =QUARTILE.INC(range,1) and =QUARTILE.INC(range,3) in two cells, subtract for the IQR, build the two fences, then flag with =IF(OR(A2<lower,A2>upper),"outlier",""). Bear in mind that QUARTILE.INC interpolates, so its quartiles can differ slightly from the ones a TI-84 or a textbook gives on small datasets.
Why does 1.5 appear in the IQR rule?
Convention rather than derivation. John Tukey chose it as a practical setting when he designed the box plot. It does have a sensible consequence: on normally distributed data it flags about 0.7 percent of values, which is often enough to be useful and rare enough not to be noise. A multiplier of 3 flags roughly 2 values in a million and is used for extreme outliers.
Do outliers have to be removed?
No. Remove a value when you can identify what went wrong with it, such as a data entry error or a missing-value code like 999. Keep it when it is simply large, which is what skewed distributions produce. If you are unsure, run the analysis both ways and report what changed. The calculator gives you a cleaned copy of the list so the second run takes seconds.
Does this outlier calculator work on decimals and negative numbers?
Yes. Commas, spaces, tabs and one value per line all parse, so a column copied out of Excel or Google Sheets goes straight in. Negative values, decimals and numbers written with thousands separators are all handled, and you can set the number of decimal places on the output.
Explore our other calculators
 Average calculator
 Average percentage calculator
 Average time calculator
 Degrees of freedom calculator
 Exponential Regression Calculator
 Five Number Summary Calculator
 Histogram maker
 IQR calculator
 Linear regression calculator
 Mean, Median, Mode and Range Calculator
 Pie Chart Maker
 Probability Calculator
 Standard deviation calculator
 Sum of Squares Calculator
 Variance calculator
 Weighted average calculator
Our latest blogs
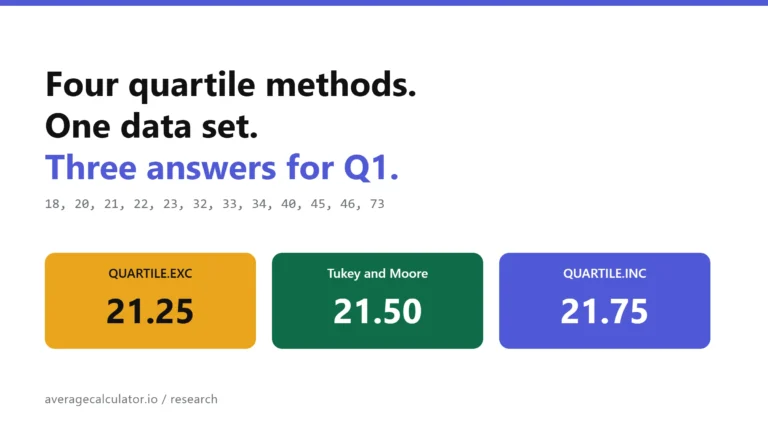
Four quartile methods, one data set, three answers for Q1
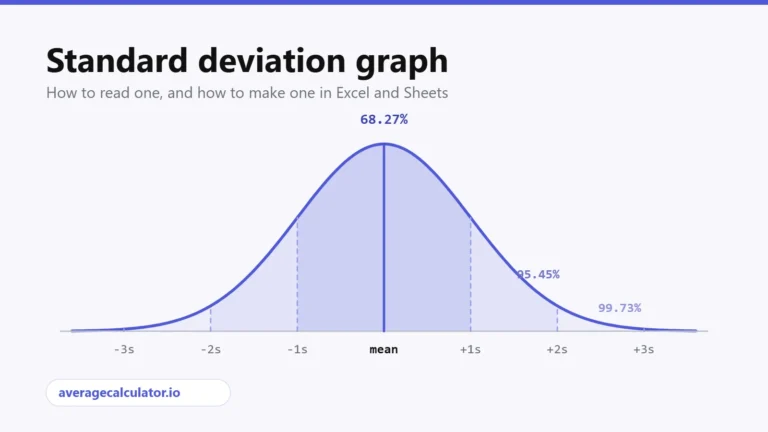
Standard deviation graph: how to read one and how to make one
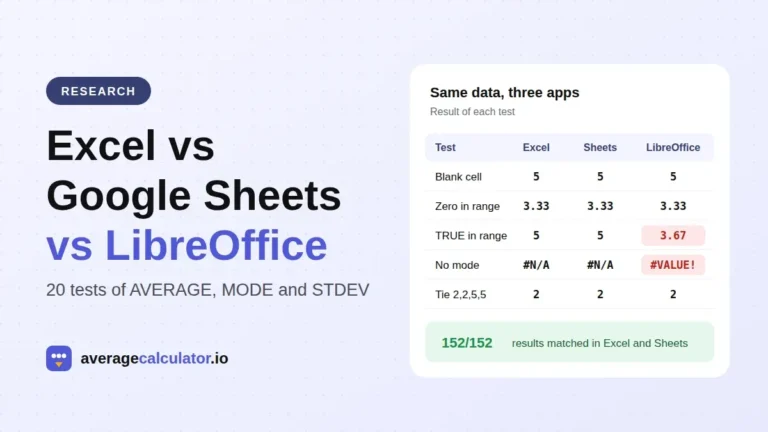
Excel vs Google Sheets vs LibreOffice: how average functions handle blanks, zeros and text
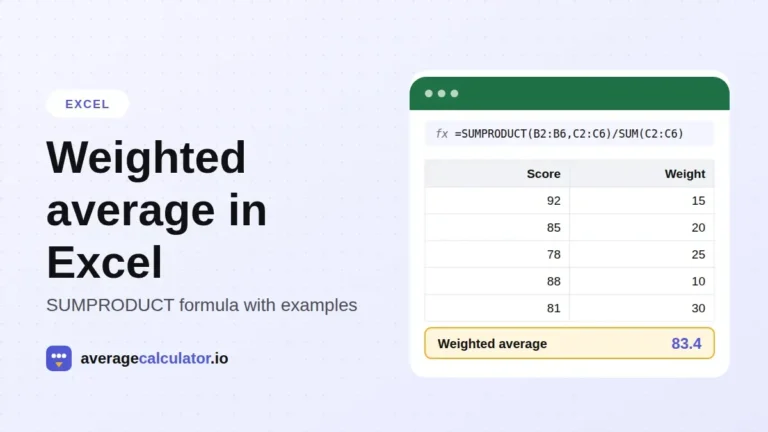
How to calculate a weighted average in Excel, with examples
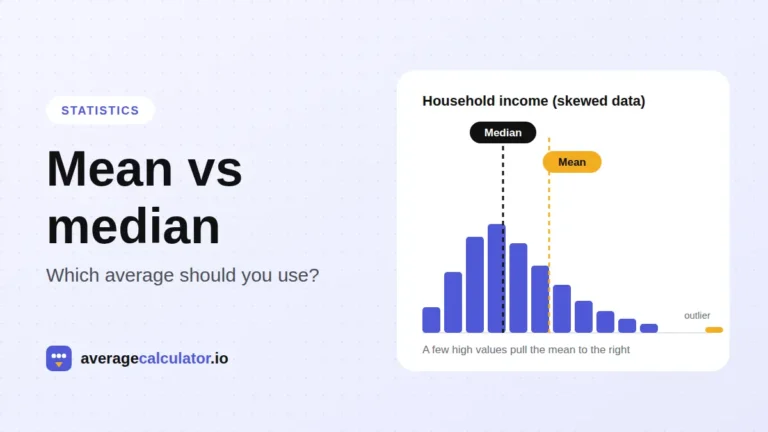
Mean vs median: which average should you use?
Who made this calculator
Spotted a mistake in this calculator? Tell us the numbers you used and what you expected, and we will check it.
Report an error