
Standard deviation graph: how to read one and how to make one


On this page
Key takeaways
- Three different charts get called a standard deviation graph: a bell curve with sigma marked, a bar chart with error bars, and a run chart with sigma bands. Which one you need depends on the question.
- On any of them, standard deviation is a width either side of the mean, measured in the same units as your data.
- The bands cover 68.27%, 95.45% and 99.73%, not 68, 95 and 99.7. The band that covers exactly 95% is 1.96 standard deviations.
- Standard deviation error bars and standard error bars can point to opposite conclusions on the same data, so always say in the caption which one you used.
- In Excel, use Custom error bars pointing at your own STDEV.S cells. The built in Standard Deviation option gives every bar the same whisker and is usually wrong.
Ask three people for a standard deviation graph and you can get three different pictures. One draws a bell curve with the Greek letter sigma along the bottom. One draws a bar chart with little whiskers on top of each bar. One draws a line over time with shaded bands around it. All three are correct, and they answer different questions.
This guide covers how to tell the three apart, how to read the numbers off each one, and how to build them in Excel and Google Sheets. It also covers the error bar mistake that quietly flips the conclusion in a lot of published charts.
Three graphs, all called a standard deviation graph
The confusion is not your fault. Standard deviation is a single number that measures spread, and spread can be drawn in more than one way depending on what you are showing.
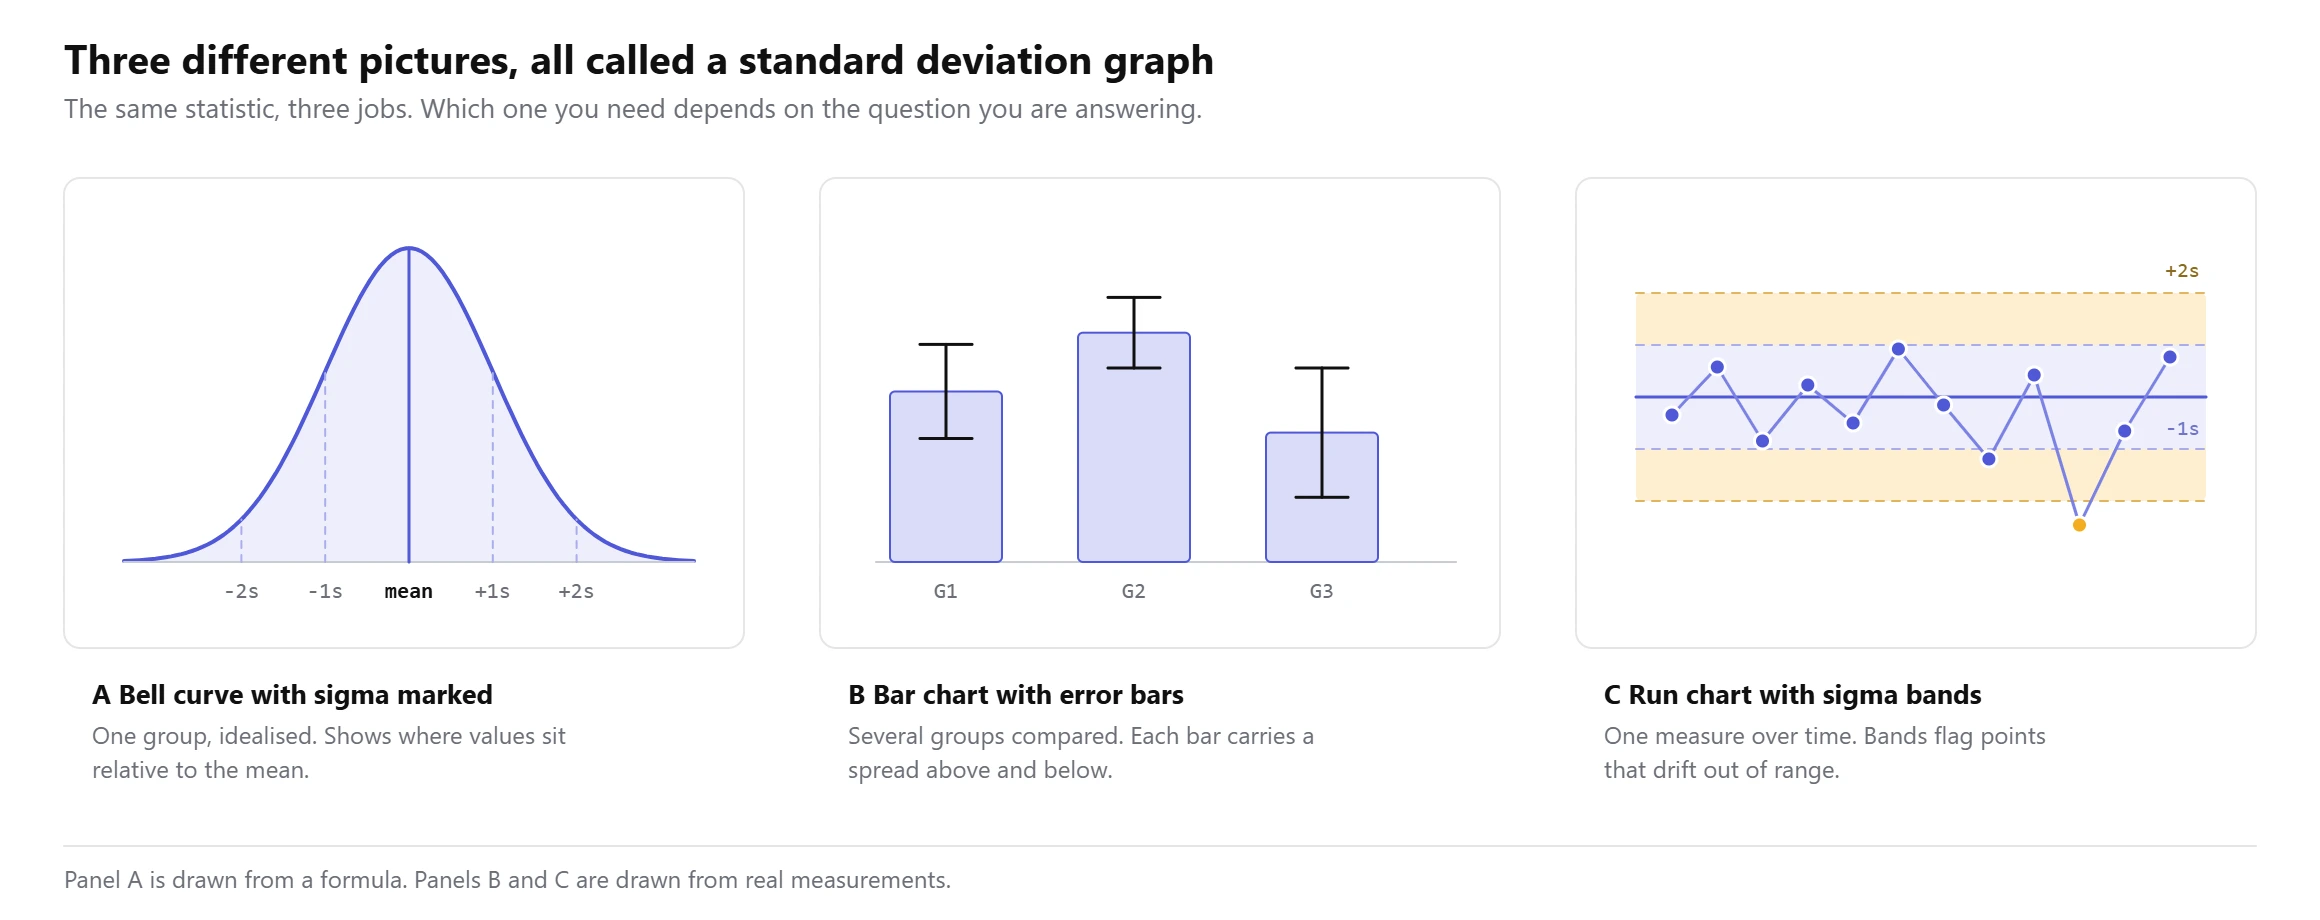
A bell curve with sigma marked is the textbook picture. It is drawn from a formula rather than from your data, and it shows where a value sits relative to the mean when the data follows a normal distribution. This is what most people picture when they hear the phrase.
A bar chart with error bars is what you see in journals and lab reports. Each bar is a group mean and the whisker shows the spread, usually one standard deviation above and below. This is the one you need when you are comparing groups.
A run chart with sigma bands tracks one measurement over time with lines drawn at one, two and three standard deviations from the mean. Factories call this a control chart. A point outside the outer band is a signal that something changed.
Pick by the question. Where does this one value sit? Bell curve. Are these groups different? Bar chart with error bars. Has this process drifted? Run chart with bands.
What standard deviation actually looks like on a graph
Standard deviation is a width, not a point. On any of these graphs it shows up as a distance either side of the mean, and the thing you read off the picture is how wide that distance is compared with the data itself.
Take ten test scores: 65, 69, 69, 70, 70, 74, 74, 75, 76, 78. They add to 720, so the mean is 72. The standard deviation works out at exactly 4.
mean = 720 / 10 = 72
one standard deviation band = 72 - 4 to 72 + 4 = 68 to 76
Draw that band on the chart and eight of the ten scores fall inside it. Widen it to two standard deviations, 64 to 80, and all ten are inside. That is the whole idea. The band is the typical range, and anything outside it is unusual for this group.
You can get the same two numbers from a standard deviation calculator if you would rather not do the arithmetic, and it will show the band as well.
High and low standard deviation on the same axis
This is where the graph earns its place, because two data sets can share a mean and look nothing alike.
Class A scored 65, 69, 69, 70, 70, 74, 74, 75, 76, 78. Class B scored 56, 59, 62, 66, 68, 74, 75, 81, 87, 92. Both have ten students and both average 72. Class A has a standard deviation of 4. Class B has a standard deviation of 12, three times as wide.
| Measure | Class A | Class B |
|---|---|---|
| Mean | 72 | 72 |
| Standard deviation | 4 | 12 |
| One sigma band | 68 to 76 | 60 to 84 |
| Scores inside that band | 8 of 10 | 6 of 10 |
| Lowest to highest | 65 to 78 | 56 to 92 |
| Range | 13 | 36 |
Report only the mean and the two classes look identical. Draw the graph and they clearly are not. A student who scores 80 is well above average in Class A and only slightly above average in Class B, even though the class average is the same number.
A low standard deviation makes a tall narrow curve, because the values are packed near the mean. A high standard deviation makes a short wide curve. The area under both curves is the same, so one has to spread out as the other rises.
If you want to see the real shape of your own data rather than an idealised curve, a histogram plots the actual counts. The bell curve is a model. The histogram is what happened.
The 68, 95 and 99.7 percentages, and what they really are
Every standard deviation graph you have seen is annotated with the same three numbers. They are the areas under a normal curve, and they are rounded.
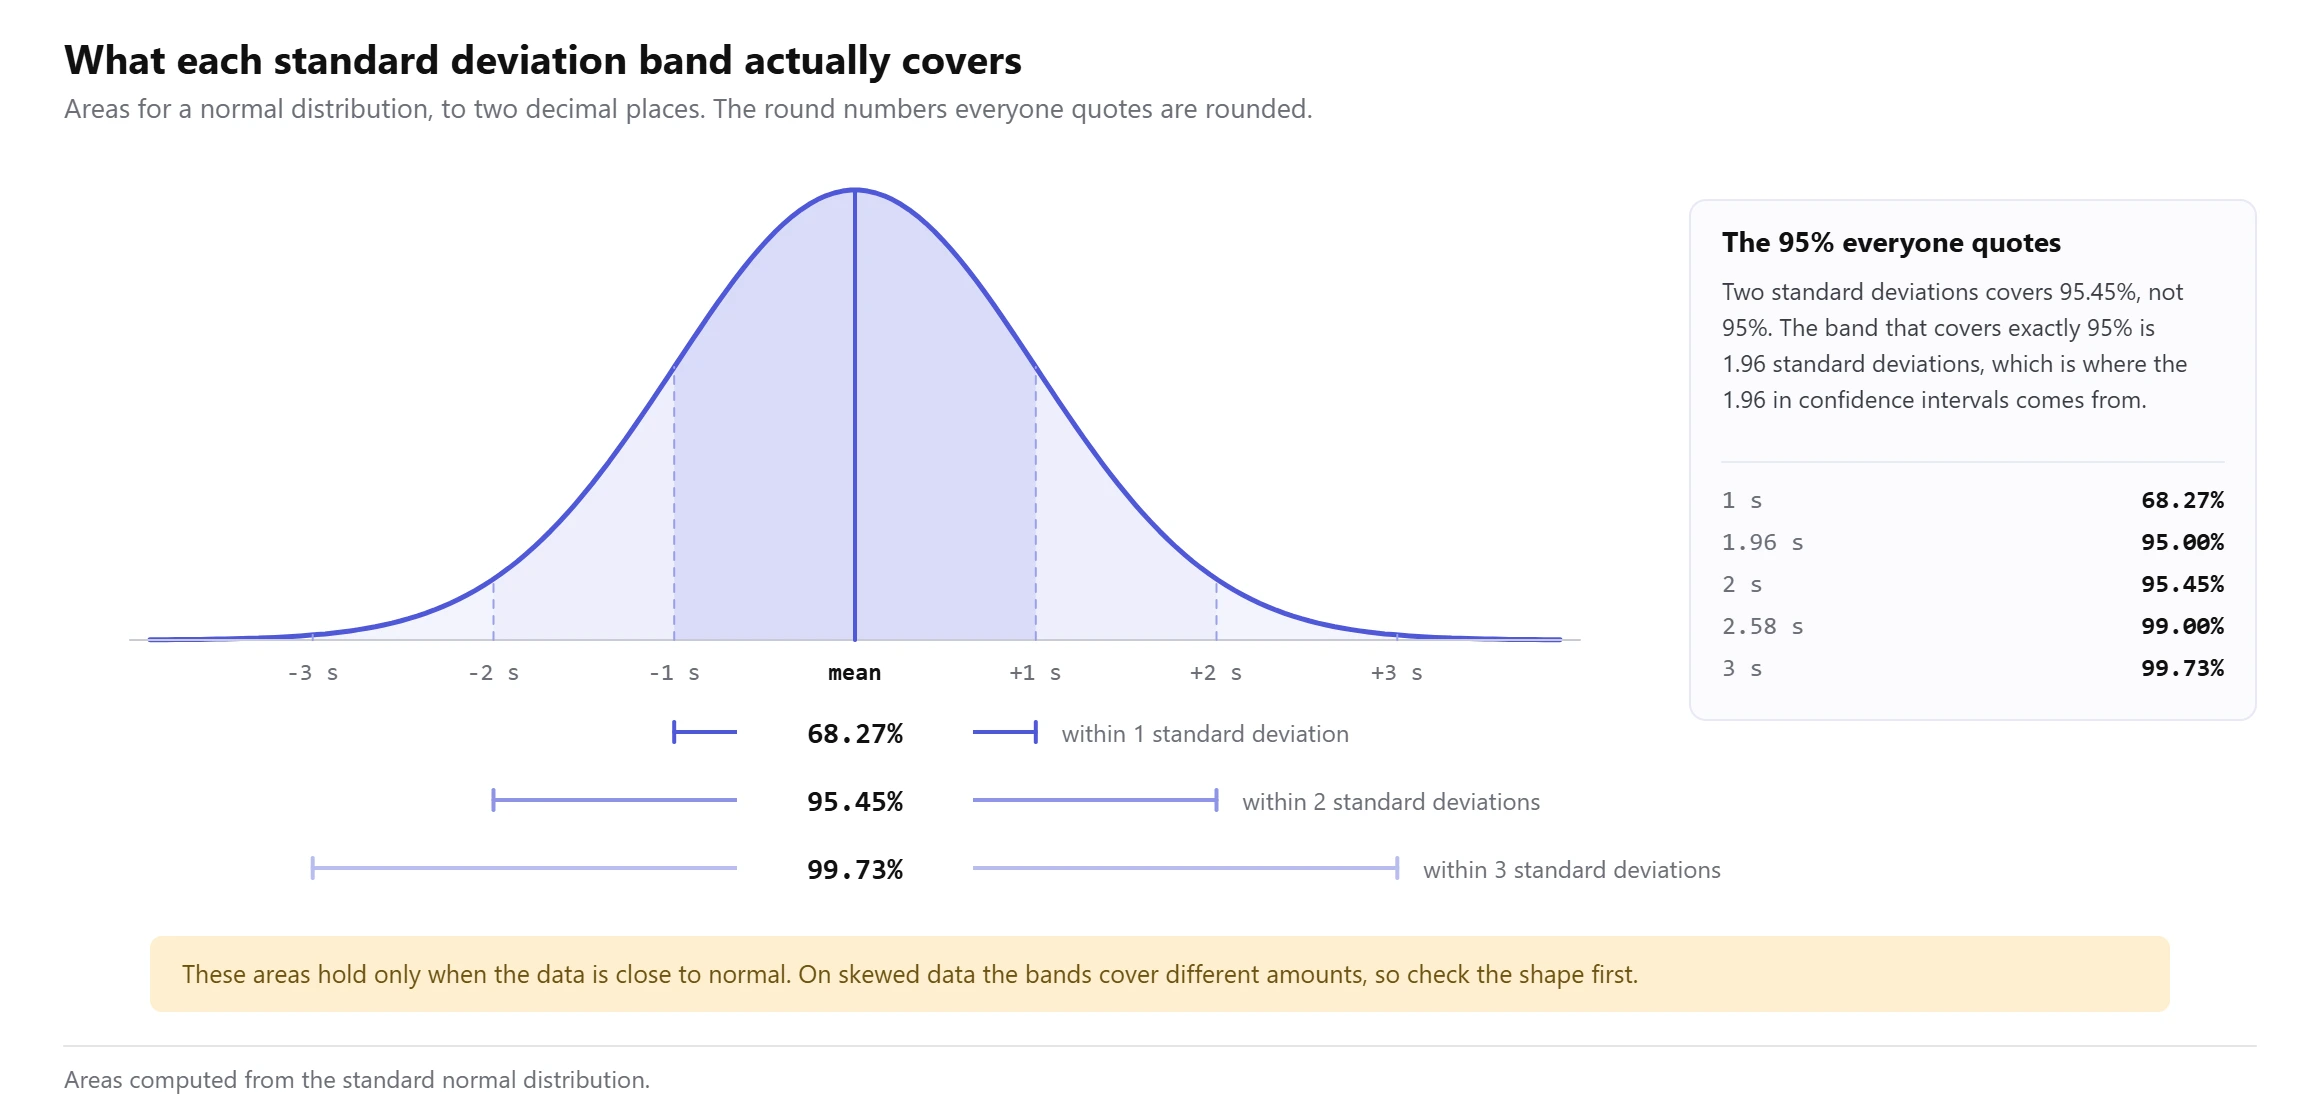
One standard deviation either side of the mean covers 68.27% of the area. Two covers 95.45%. Three covers 99.73%. The familiar 68, 95, 99.7 are those figures rounded, which is fine for reading a chart and not fine for a calculation.
The gap between 95% and 95.45% is worth knowing. The band that covers exactly 95% is 1.96 standard deviations, not 2. That 1.96 is the number inside every 95% confidence interval, and it is why a confidence interval is slightly narrower than two standard errors.
All of this assumes the data is close to normal. On a skewed data set the bands still exist but they cover different amounts, and a mean plus a standard deviation stops describing the shape well. For skewed data a five number summary and a box plot carry more information than a bell curve does.
Error bars: the choice that flips the conclusion
If you are drawing a bar chart with error bars, you have to decide what the bars represent, and that single decision can reverse what the chart appears to say.
Standard deviation bars show how spread out the individual measurements are. Standard error bars show how precisely you have pinned down the mean, and standard error is the standard deviation divided by the square root of the sample size. With ten observations, standard error is about a third of the standard deviation, so the bars are about a third as long.
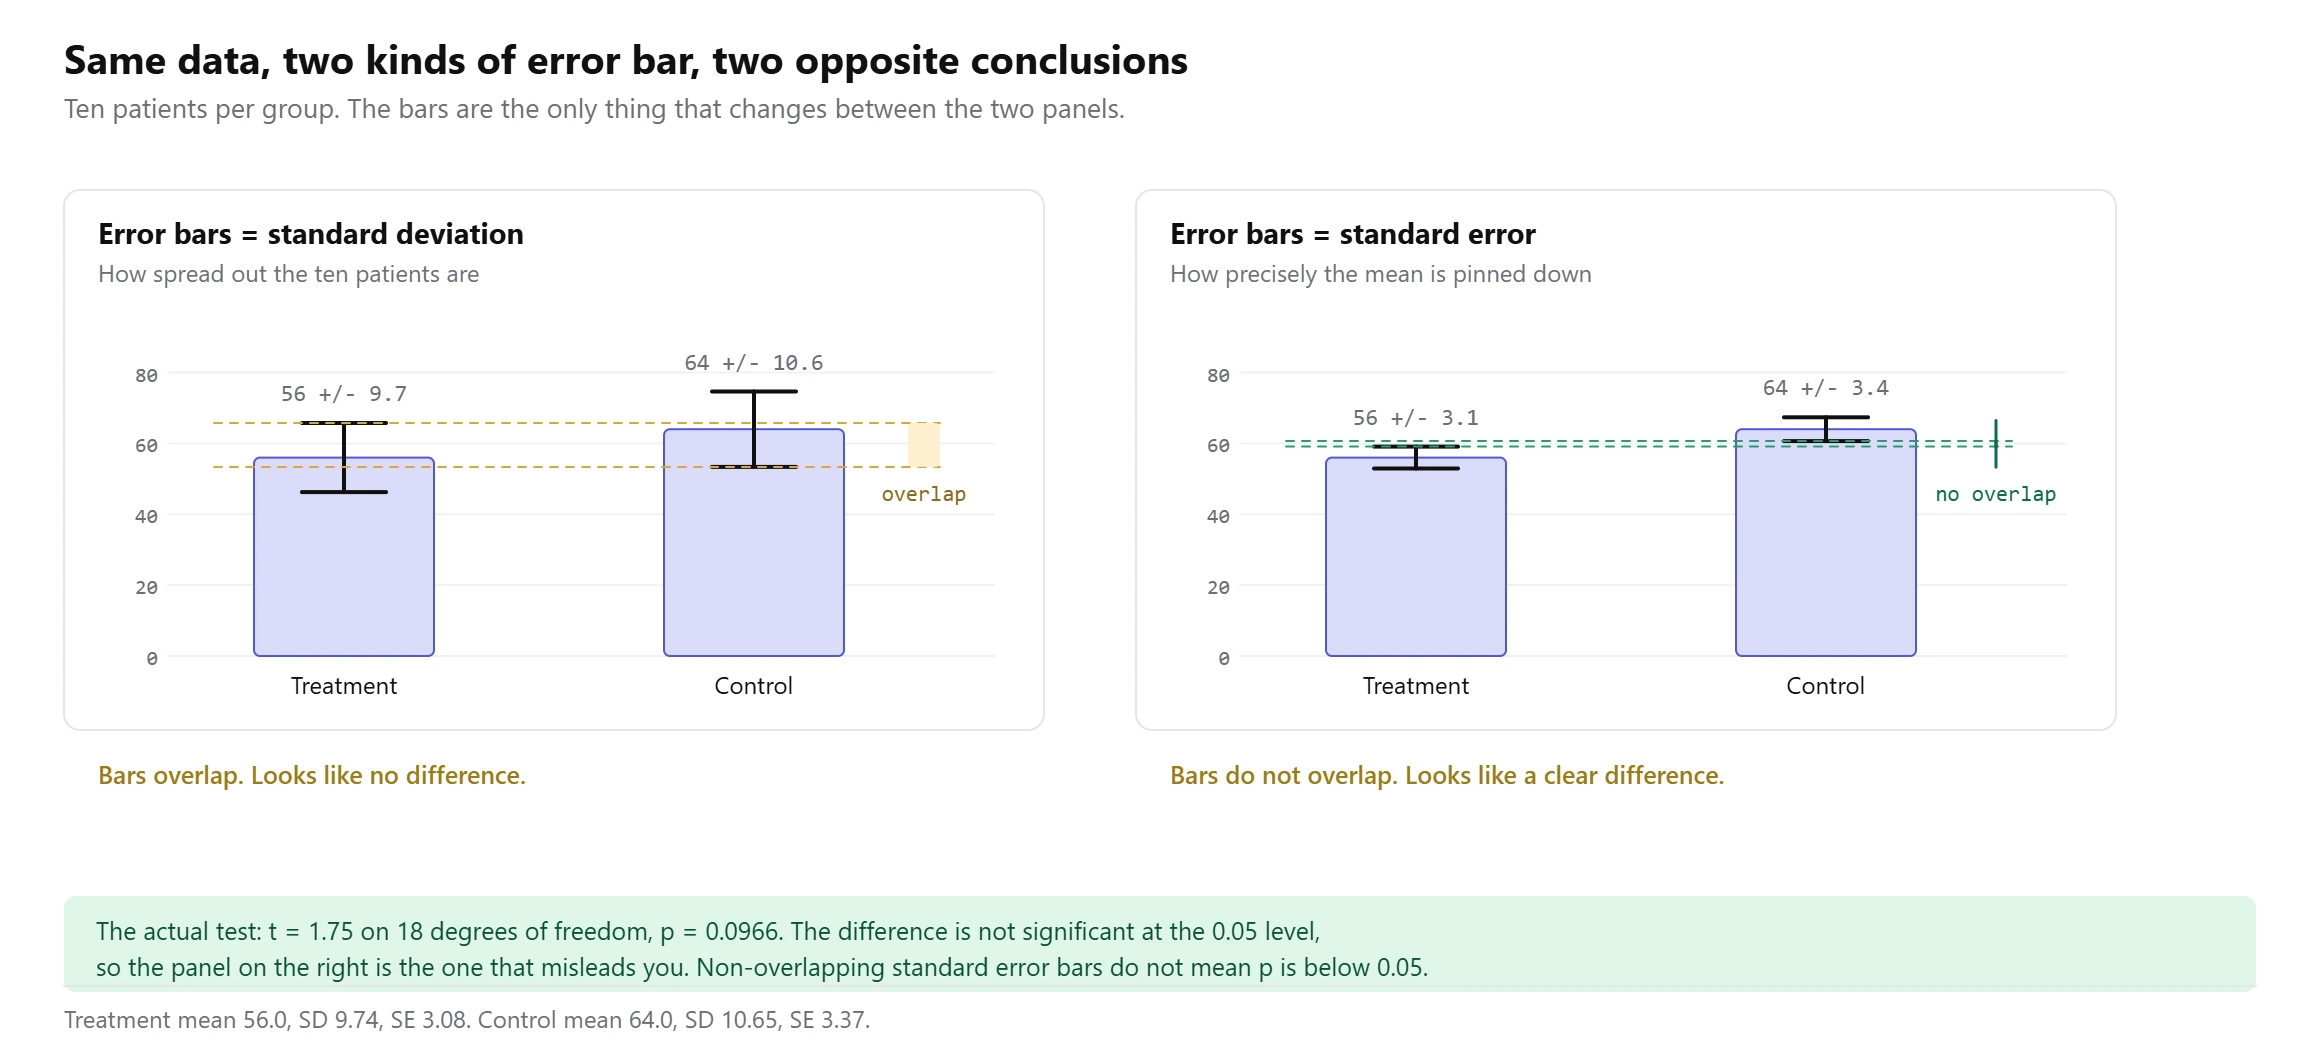
Here is the same experiment drawn twice. Treatment averaged 56.0 with a standard deviation of 9.74. Control averaged 64.0 with a standard deviation of 10.65. Ten patients in each group.
standard error = standard deviation / square root of n
treatment: 9.74 / sqrt(10) = 3.08
control:   10.65 / sqrt(10) = 3.37
Draw standard deviation bars and they overlap heavily, which reads as no difference. Draw standard error bars and they do not touch, which reads as a clear difference. Nothing about the data changed.
The actual two sample t test gives t = 1.75 on 18 degrees of freedom and p = 0.0966. At the usual 0.05 threshold that is not significant. So the chart that looked convincing is the one that misled you.
Two things follow. Non-overlapping standard error bars do not prove a significant difference, and overlapping standard deviation bars do not rule one out. The only safe habit is to label the bars in the caption, every time, with the sample size next to them. A reader who does not know whether a whisker is one standard deviation, one standard error or a 95% interval cannot read your chart at all.
How to make a standard deviation graph in Excel
There are two jobs here and Excel handles them differently. Decide first whether you are adding spread to a chart of real groups, or drawing a smooth bell curve.
Bar chart with error bars
- Put each group’s values in its own column.
- In a spare cell use
=AVERAGE(A2:A11)for the mean and=STDEV.S(A2:A11)for the sample standard deviation. Use STDEV.P only when your rows are the entire group rather than a sample. - Select the means and insert a clustered column chart.
- Click the chart, open Chart Elements, tick Error Bars, then choose More Options.
- Pick Custom, click Specify Value, and point both the plus and the minus box at your standard deviation cells.
- Write what the bars are in the chart title or the caption.
Excel does offer a built in Standard Deviation option in the error bar menu. Avoid it. It calculates one standard deviation across the whole plotted series rather than within each group, so every bar gets the same whisker and the chart is wrong. Custom with your own cells is the only reliable route.
Bell curve
- Put your mean in one cell and your standard deviation in another, say E1 and E2.
- In column A build an x axis running from about four standard deviations below the mean to four above, in small steps.
- In column B enter the formula below and fill down. The FALSE argument asks for the curve height rather than the running total.
- Select both columns and insert a Scatter with Smooth Lines chart.
- Add vertical lines at the mean and at each sigma step if you want the bands marked.
=NORM.DIST(A2, $E$1, $E$2, FALSE)Swap FALSE for TRUE and you get the cumulative curve instead, which answers what share of values sit below a given point.
How to make one in Google Sheets
Sheets takes the same functions. AVERAGE, STDEV and STDEVP all work, and NORMDIST(x, mean, sd, FALSE) draws the curve.
For error bars, insert the chart, open Chart editor, go to Customise and then Series, and tick Error bars. Sheets gives you Constant, Percent and Standard Deviation. The Standard Deviation setting has the same problem as the Excel one, so for per group bars put your own values in a column and choose Constant only when every group genuinely shares the same spread. Where the groups differ, a scatter chart with a separate series for the upper and lower points gives you honest whiskers.
One behaviour catches people out in both programs. If a cell holds text such as “n/a”, AVERAGE skips it but AVERAGEA counts it as zero, and your mean drops without warning. We tested how eight functions handle blanks, text and zeros across Excel, Google Sheets and LibreOffice, and the differences were larger than expected.
How to read a standard deviation graph
Work through it in this order and the chart gives up its meaning quickly.
- Find the mean first. On a bell curve it is the peak. On a bar chart it is the top of the bar.
- Read the width of one band. That distance is one standard deviation, and it is the number the whole chart is built on.
- Compare that width with the full range of the data. A band that covers most of the range means the values are tightly packed.
- Check what the error bars are. If the caption does not say, you cannot interpret the gap between groups.
- Check the sample size. Ten observations and a thousand observations give very different standard errors from the same standard deviation.
- Look at where zero sits on the y axis. A chart that starts at 50 instead of 0 makes small differences look dramatic.
Values more than about three standard deviations from the mean deserve a second look before you treat them as real. Whether they are genuine extremes or recording errors is a separate question, and an outlier test answers it more carefully than eyeballing the chart does.
Where standard deviation graphs mislead
Unlabelled error bars. Covered above and worth repeating, because it is the single most common problem in published charts. A whisker with no caption is decoration.
Assuming a bell shape that is not there. Incomes, waiting times and reaction times are usually skewed to the right. Draw a symmetric band around the mean and the lower edge can land somewhere impossible, like a negative waiting time.
A truncated y axis. Starting the axis above zero stretches the gaps. The error bars stretch with them, so a difference of two units can be made to look like a chasm.
Mixing sample and population formulas. STDEV.S divides by n minus 1 and STDEV.P divides by n. On ten values that is a difference of about 5% in the standard deviation, and every band on the chart moves with it.
Reporting standard deviation when you mean variance. The two carry the same information, but variance is in squared units, so a variance of 16 and a standard deviation of 4 describe the same data. Only the standard deviation can be drawn on the same axis as the values.
Too few points. A standard deviation from three observations is barely an estimate. Below about ten values the band moves a lot when one number changes.
Frequently asked questions
What is the standard deviation on a graph?
It is the horizontal distance from the mean out to the edge of the first band, or the length of one arm of an error bar. It is measured in the same units as your data, so on a chart of test scores one standard deviation is a number of marks.
What is a standard deviation graph called?
It depends which one you mean. The bell shaped one is a normal distribution curve or normal curve. The bar chart version is a bar chart with error bars. The version tracking a process over time is a control chart. There is no single official name, which is why the search term is so ambiguous.
How can I visualise standard deviation?
The quickest honest way is a histogram of your actual values with a vertical line at the mean and two more at one standard deviation either side. That shows the spread and the real shape at the same time, which a smooth curve cannot do.
How do I create a standard deviation graph in Excel?
For groups, chart the means and add Custom error bars pointing at cells that hold each group’s STDEV.S. For a bell curve, build an x axis around the mean and plot NORM.DIST against it as a scatter with smooth lines. Full steps are above.
Should error bars show standard deviation or standard error?
Use standard deviation when you are describing how variable the measurements are. Use standard error when the point of the chart is how well you know the mean. Either is defensible. Leaving the reader to guess is not.
What does a wide bell curve mean?
A large standard deviation relative to the scale. The values are spread out, so the mean describes any single observation less well. A narrow curve means the opposite, and knowing the mean tells you most of what you need.
Can I draw a standard deviation graph for skewed data?
You can calculate it, but the picture will mislead. A symmetric band around the mean implies a symmetric distribution. For skewed data, show the median with quartiles in a box plot instead, which makes no assumption about shape.
What is the difference between a standard deviation graph and a histogram?
A histogram is drawn from your data and shows the real counts in each bin. A bell curve is drawn from a formula using only the mean and the standard deviation. Put one on top of the other and the gap between them tells you how far from normal your data really is.
About the author
More from the blog
Spotted a mistake in this article? Tell us the numbers you used and what you expected, and we will check it.
Report an error