
Excel vs Google Sheets vs LibreOffice: how average functions handle blanks, zeros and text



On this page
Stats you can quote
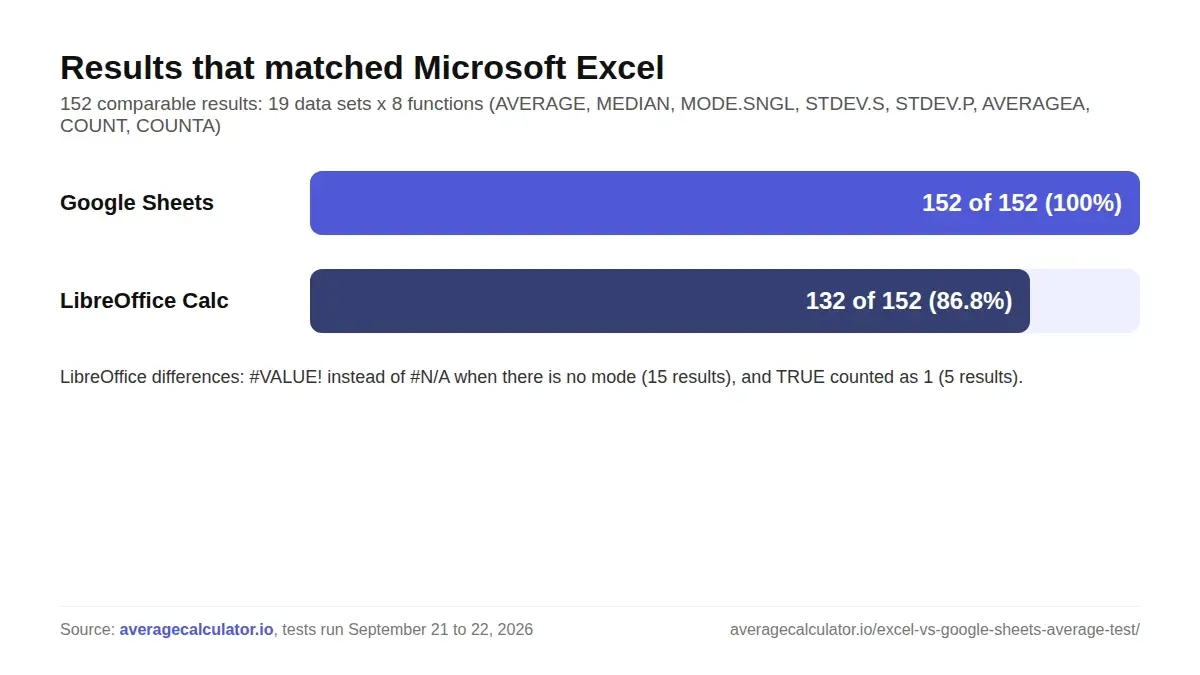
Excel and Google Sheets returned the same result in all 152 comparable tests of AVERAGE, MEDIAN, MODE.SNGL, STDEV.S, STDEV.P, AVERAGEA, COUNT and COUNTA.
Source: averagecalculator.ioCopy stat with sourceLibreOffice Calc differed from Excel in 20 of 152 results, mostly because it returns #VALUE! instead of #N/A when a list has no mode.
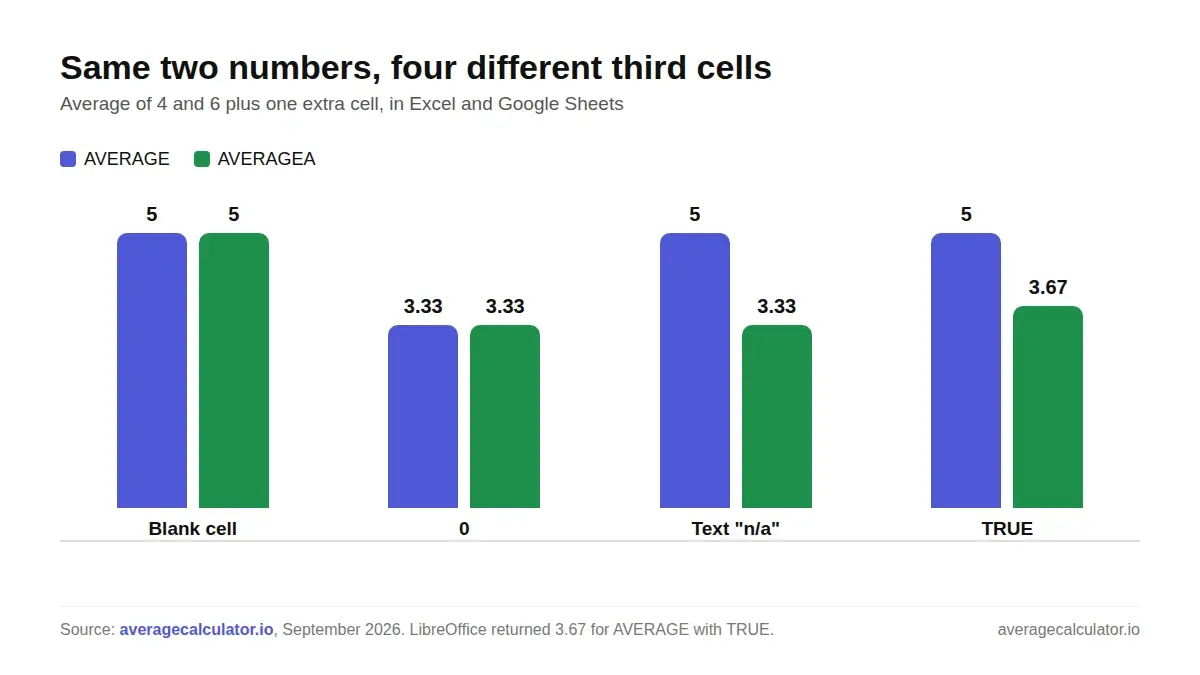
Source: averagecalculator.ioCopy stat with sourceLibreOffice Calc counted a TRUE cell as 1, which changed the average of 4, TRUE and 6 from 5 to 3.67.
Source: averagecalculator.ioCopy stat with sourceTyping 0 instead of leaving a cell blank lowered the average of 4 and 6 from 5 to 3.33 in Excel, Google Sheets and LibreOffice.
Source: averagecalculator.ioCopy stat with sourceAVERAGEA returned 3.33 instead of 5 for 4, n/a and 6, because it counts text as zero.
Source: averagecalculator.ioCopy stat with sourceWith two values, STDEV.S was 41% higher than STDEV.P: 1.414 against 1.
Source: averagecalculator.ioCopy stat with sourceWe ran the same 20 data sets through AVERAGE, MEDIAN, MODE.SNGL, STDEV.S, STDEV.P, AVERAGEA, COUNT and COUNTA in Microsoft Excel, Google Sheets and LibreOffice Calc. Excel and Google Sheets matched on every comparable result. LibreOffice Calc gave a different answer or error in 20 of 152 results. The bigger surprises came from the data itself: a 0 where a blank should be, the text “n/a” inside a range, and a tie for the mode all changed the answer in ways that are hard to spot.
How we tested
We built one test file with 20 short data sets. Each set targets one situation that causes wrong averages in real spreadsheets: a blank cell, a zero, the text “n/a”, a number stored as text, a TRUE value, an error cell, a tie for the mode, a single value, 16-digit numbers, percentages, times and one large outlier. Every row runs the same eight functions over the same five cells.
We opened the file in Microsoft Excel (Microsoft 365, version 16), recalculated it in LibreOffice Calc 24.2 and entered the same data in Google Sheets in a web browser by pasting the values in. The tests ran on September 21 and 22, 2026. That gives 160 results per app. We left one data set out of the comparison, for the reason explained under “16-digit numbers” below, which leaves 152 comparable results.
We then entered the same lists into two online tools: the Calculator.net mean, median, mode and range calculator, and our own average calculator. Online tools take a typed list rather than a range of cells, so blanks and TRUE values behave differently there.
What we found
Excel and Google Sheets agreed on every comparable result
All 152 comparable results matched between Excel and Google Sheets, including the error values. Both returned #N/A from MODE.SNGL when no value repeats, #DIV/0! from STDEV.S for a single value, and #DIV/0! from every function when an error cell sat inside the range. In all of our test cases, these eight functions gave the same numbers in both apps.
Where LibreOffice Calc was different
LibreOffice Calc matched Excel on 132 of the 152 results. Fifteen of the 20 differences came from one behavior: when a list has no repeated value, LibreOffice returns #VALUE! from MODE.SNGL where Excel and Google Sheets return #N/A. The answer means the same thing, but a formula that checks for #N/A with IFNA will not catch it in LibreOffice.
The other five differences all came from the TRUE test. For 4, TRUE and 6, Excel and Google Sheets skipped the TRUE cell and returned an average of 5. LibreOffice counted TRUE as 1, so AVERAGE returned 3.667, MEDIAN returned 4 and COUNT returned 3. LibreOffice stores TRUE and FALSE as the numbers 1 and 0, which explains the result. LibreOffice documents AVERAGE and the related functions in its Calc statistical functions help.
A blank cell and a zero are not the same
Leaving the middle cell blank gave an average of 5 for 4 and 6. Typing 0 in that cell gave 3.333, a third lower. All three apps agreed, because AVERAGE skips empty cells and counts zeros. A formula that returns empty text, ="", behaved like a blank in AVERAGE and gave 5. Microsoft’s AVERAGE reference and Google’s AVERAGE help both document this.
AVERAGEA counts text as zero
With 4, “n/a” and 6, AVERAGE ignored the text and returned 5, while AVERAGEA counted “n/a” as 0 and returned 3.333. The same happened when the 5 was stored as text: AVERAGE returned 5 from the two real numbers, and AVERAGEA returned 3.333. AVERAGEA is rarely what you want for a column that mixes numbers and notes. Microsoft’s AVERAGEA reference confirms that text in a range counts as 0.
A tie for the mode depends on the order of your data
MODE.SNGL returns a single value. For 2, 2, 5, 5 all three apps returned 2. For the same numbers in the order 5, 5, 2, 2 they returned 5. Neither answer is wrong, but the function hides the second mode. MODE.MULT, or a calculator that lists every mode, shows both. Microsoft’s MODE.SNGL reference also documents the #N/A result for lists with no repeated value.
STDEV.S and STDEV.P drift apart on small samples
For 4 and 6, STDEV.S returned 1.414 and STDEV.P returned 1, a 41% gap. With three values the gap was about 22%, and with the five-value outlier set it was 12%. STDEV.S divides by one less than the count, so the difference shrinks as the list grows. For a single value, STDEV.S returned #DIV/0! in every app and STDEV.P returned 0. See Microsoft’s STDEV.S reference for the sample formula.
Online calculators handle text very differently
Calculator.net refused any list that contained text and showed “Please provide numbers only.” for both “4, n/a, 6” and “4, TRUE, 6”. It also asked for at least two numbers when we entered a single 7, even though the mean of one number is that number. For 2, 2, 5, 5 it reported both modes, and for 1, 2, 3, 4 it said every value appeared once.
Our average calculator skipped “n/a” and “TRUE”, returned 5 and showed a warning naming the skipped entry. It listed both modes for 2, 2, 5, 5 in either order, showed “None” for 1, 2, 3, 4 and returned n/a for the sample standard deviation of a single value. We run averagecalculator.io, so read that result as a description of our own tool.
16-digit numbers
Excel and LibreOffice kept the three 16-digit numbers as numbers and returned an average of 1,000,000,000,000,002. When we pasted the same values into Google Sheets, it stored them as text, so COUNT returned 0 and AVERAGE returned #DIV/0!. Because the entry method was not the same, we kept this case out of the 152-result comparison. Spreadsheets keep about 15 significant digits, so long IDs such as account or order numbers are safer in text cells.
Full results
The table shows the Excel result for each data set and any app that returned something different. Google Sheets matched Excel on every row except case 15. The data file below has all eight functions for all three apps.
| # | What we tested | Data | AVERAGE | AVERAGEA | MODE.SNGL | STDEV.S | Differences |
|---|---|---|---|---|---|---|---|
| 1 | Whole numbers | 2, 4, 6, 8 | 5 | 5 | #N/A | 2.582 | LibreOffice: #VALUE! for MODE.SNGL |
| 2 | Blank cell | 4, (blank), 6 | 5 | 5 | #N/A | 1.414 | LibreOffice: #VALUE! for MODE.SNGL |
| 3 | Zero | 4, 0, 6 | 3.333 | 3.333 | #N/A | 3.055 | LibreOffice: #VALUE! for MODE.SNGL |
| 4 | Text in the range | 4, n/a, 6 | 5 | 3.333 | #N/A | 1.414 | LibreOffice: #VALUE! for MODE.SNGL |
| 5 | Number stored as text | 4, “5”, 6 | 5 | 3.333 | #N/A | 1.414 | LibreOffice: #VALUE! for MODE.SNGL |
| 6 | TRUE value | 4, TRUE, 6 | 5 | 3.667 | #N/A | 1.414 | LibreOffice: AVERAGE 3.667, MEDIAN 4, STDEV.S 2.517, STDEV.P 2.055, COUNT 3, #VALUE! for MODE.SNGL |
| 7 | Negative numbers | -3, -1, 2, 5 | 0.75 | 0.75 | #N/A | 3.5 | LibreOffice: #VALUE! for MODE.SNGL |
| 8 | Decimals | 0.1, 0.2, 0.3 | 0.2 | 0.2 | #N/A | 0.1 | LibreOffice: #VALUE! for MODE.SNGL |
| 9 | Even count | 1, 3, 5, 7 | 4 | 4 | #N/A | 2.582 | LibreOffice: #VALUE! for MODE.SNGL |
| 10 | Tie, smaller value first | 2, 2, 5, 5 | 3.5 | 3.5 | 2 | 1.732 | None |
| 11 | Tie, larger value first | 5, 5, 2, 2 | 3.5 | 3.5 | 5 | 1.732 | None |
| 12 | No repeated values | 1, 2, 3, 4 | 2.5 | 2.5 | #N/A | 1.291 | LibreOffice: #VALUE! for MODE.SNGL |
| 13 | Single value | 7 | 7 | 7 | #N/A | #DIV/0! | LibreOffice: #VALUE! for MODE.SNGL |
| 14 | All values the same | 3, 3, 3 | 3 | 3 | 3 | 0 | None |
| 15 | 16-digit numbers | 1000000000000001 to 1000000000000003 | 1000000000000002 | 1000000000000002 | #N/A | 1 | Google Sheets stored the pasted values as text: AVERAGE #DIV/0! |
| 16 | Error cell | 4, #DIV/0!, 6 | #DIV/0! | #DIV/0! | #DIV/0! | #DIV/0! | None |
| 17 | Formula returning empty text | 4, ="", 6 | 5 | 3.333 | #N/A | 1.414 | LibreOffice: #VALUE! for MODE.SNGL |
| 18 | Percentages | 50%, 75%, 100% | 75% | 75% | #N/A | 0.25 | LibreOffice: #VALUE! for MODE.SNGL |
| 19 | Times | 1:30, 2:00 | 1:45 | 1:45 | #N/A | 0.0147 | LibreOffice: #VALUE! for MODE.SNGL |
| 20 | One large outlier | 1, 2, 3, 4, 100 | 22 | 22 | #N/A | 43.618 | LibreOffice: #VALUE! for MODE.SNGL |
What this means for your spreadsheets
- Leave a missing value blank. Type 0 only when the value really is zero.
- Use AVERAGE, not AVERAGEA, for a column that may contain notes such as “n/a”.
- Pick STDEV.S when your data is a sample and STDEV.P when you have every value in the group. On small lists the two can differ by 20% or more. Our standard deviation calculator shows both, with every step.
- When a list could have two modes, use MODE.MULT or a calculator that lists every mode.
- If you open Excel files in LibreOffice, check any AVERAGE or COUNT over cells that hold TRUE or FALSE.
- Store IDs longer than 15 digits as text.
- Times average correctly, but the standard deviation comes back in days, so format the result cell as time or work in minutes. Our average time calculator takes 1:30 and 2:00 as they are.
- Check for outliers before you report a mean. In case 20 the mean was 22 while the median was 3, and our guide to mean vs median explains which one to use.
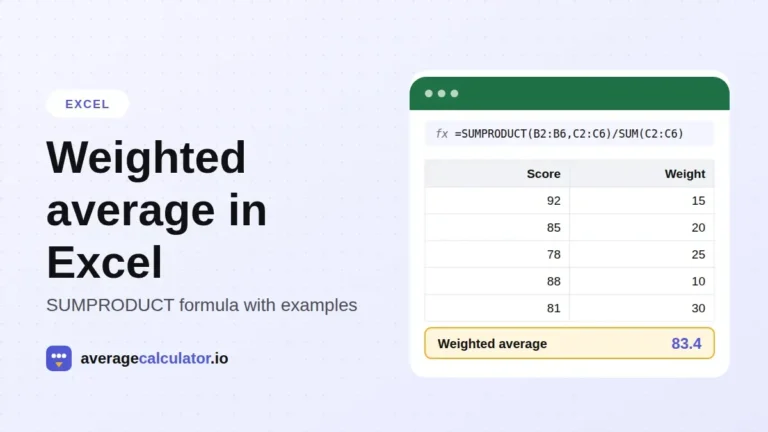
- For weighted results, use SUMPRODUCT divided by SUM. Our weighted average in Excel guide walks through it step by step.
To check a list step by step, paste it into our average calculator. This study is part of our research, and every study there is free to cite. It shows the mean, median, every mode and the sample or population standard deviation, and tells you which entries it skipped.
About the author
Download the data
You are welcome to use these results. Please link to this page when you do.
How to cite this study
averagecalculator.io. "Excel vs Google Sheets vs LibreOffice: how average functions handle blanks, zeros and text." Updated October 2026. https://www.averagecalculator.io/excel-vs-google-sheets-average-test/
Copy citationJournalists and researchers: for questions about this data, email [email protected].
More from the blog
Spotted a mistake in this article? Tell us the numbers you used and what you expected, and we will check it.
Report an error