
Standard deviation calculator
Paste a list of numbers or a frequency table to get the mean and standard deviation for a sample or a population, with the variance and a step-by-step solution.

 By Ozlem Ozturk · Reviewed by Susan Simmons✓ Fact-checked
How to use the standard deviation calculator
- 1Enter your data
Type or paste numbers separated by commas, spaces or new lines. A column copied from Excel or Google Sheets works too.
- 2Pick sample or population
Choose sample if your numbers are part of a bigger group. Choose population if you have every value in the group.
- 3Use a frequency table if you have counts
Switch tabs and enter each value with how many times it appears, such as 4 12.
- 4Press Calculate
You get the standard deviation, variance, mean, standard error and every step of the working.
Step-by-step solution
What is standard deviation?
Standard deviation measures how far values usually sit from their mean. A small standard deviation means the numbers are bunched close to the average. A large one means they are spread out.
Two classes can both average 80 on a test. If one class has a standard deviation of 3, nearly everyone scored between about 74 and 86. If the other has a standard deviation of 15, the scores run from the 50s to the high 90s. The mean alone hides that difference.
It is reported in the same units as your data, so a standard deviation of 9.45 points on a test means 9.45 points. That is the main reason people report it instead of the variance, which is in squared units.
Standard deviation formula
There are two versions. Use the sample formula when your numbers are a subset of a larger group, and the population formula when you have every member of the group.
Sample: s = √( Σ(x − x̄)² / (n − 1) )
Population: σ = √( Σ(x − μ)² / N )
Here x is each value, x̄ or μ is the mean, and n or N is how many values there are. The only difference is the divisor. The National Library of Medicine’s statistics course works through the population version using the heights of nine students.
How to find standard deviation
To find the standard deviation of a data set, you need the mean first. Every step after that measures how far the values sit from the mean. This is how to calculate it by hand:
- Find the mean: add the values and divide by how many there are.
- Subtract the mean from each value.
- Square each of those differences so negatives do not cancel positives.
- Add the squares. This total is the sum of squares.
- Divide by n − 1 for a sample or by N for a population. The result is the variance.
- Take the square root of the variance.
Worked example
Take the eight values 2, 4, 4, 4, 5, 5, 7 and 9.
- Mean: 40 / 8 = 5
- Differences from the mean: −3, −1, −1, −1, 0, 0, 2, 4
- Squared: 9, 1, 1, 1, 0, 0, 4, 16
- Sum of squares: 32
- Population variance: 32 / 8 = 4, so σ = √4 = 2
- Sample variance: 32 / 7 = 4.5714, so s = √4.5714 = 2.1381
Click “Small example” in the calculator to see the same working laid out step by step.
Shortcut formula
Many textbooks also give a version that skips the individual differences and works from the sum of the values and the sum of their squares:
s² = ( Σx² − (Σx)² / n ) / (n − 1)
For the same eight values, Σx = 40 and Σx² = 4 + 16 + 16 + 16 + 25 + 25 + 49 + 81 = 232. That gives s² = (232 − 1,600 / 8) / 7 = 32 / 7 = 4.5714, the same answer as before. It is faster on paper, but with large values that sit close together it can lose precision, so the calculator uses the two-step method.
Sample vs population standard deviation
Most real data is a sample. Ten test scores from one class, 30 customer orders from last week or eight months of fund returns are all samples if you want to say something about the wider group they came from. Use s.
Use σ only when the data is the whole group you care about and you are not generalizing past it, such as the final grades of every student in a class of 25 when you only want to describe that class.
Dividing by n − 1 is called Bessel’s correction, and that n − 1 is the degrees of freedom of the sample. A sample’s values sit a little closer to their own mean than to the true population mean, so dividing by n would understate the spread. With large data sets the gap is tiny: for 1,000 values the two results differ by about 0.05%. With 5 values the sample figure is about 12% larger.
If you are not sure, pick sample. The “Data set is” dropdown switches the tool between a sample standard deviation calculator and a population standard deviation calculator, and the results show the other value too, so you can compare.
Standard deviation of a frequency table
When a value repeats many times, it is quicker to enter each value once with its count. The formula weights each squared difference by its frequency f:
s = √( Σf(x − x̄)² / (n − 1) ), where n = Σf
For 60 dice rolls where 1 came up 8 times, 2 came up 11 times, 3 came up 9 times, 4 came up 12 times, 5 came up 10 times and 6 came up 10 times, the mean is 215 / 60 = 3.5833. The sum of squares is 164.5833, the sample variance is 164.5833 / 59 = 2.7895 and s = 1.6702. Switch to the Frequency table tab and click “Dice rolls” to check it.
The mean step is the same idea as a weighted average, with the counts acting as the weights. The same counts also go straight into the histogram maker if you want to see the spread rather than read it off a single number.
How to interpret standard deviation
What a standard deviation tells you depends on the shape of your data. For data that follows a bell-shaped normal distribution, about 68% of values fall within one standard deviation of the mean, about 95% within two and about 99.7% within three. Drawn out, that picture is the standard deviation graph you have seen in textbooks, and the exact areas are 68.27%, 95.45% and 99.73%. The test scores sample has a mean of 80 and s = 9.45, so a typical score sits somewhere between about 70.5 and 89.5. Six of the ten scores do.
The z score in the chart under the calculator tells you how many standard deviations each value is from the mean. A score of 95 has z = 1.59. Values beyond about 2 or 3 are unusual in normal data and worth a second look. Those 68, 95 and 99.7 figures are probabilities, and the probability calculator will combine one of them with a second event if you need the chance of both, or of either.
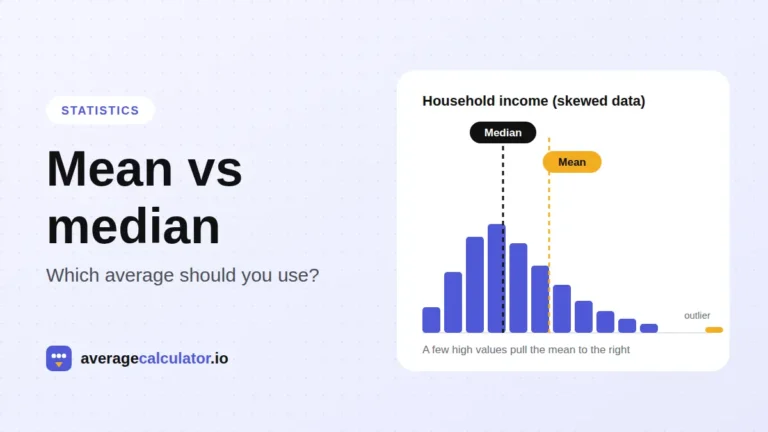
Standard deviation is pulled up by outliers because each difference is squared. One extreme value can double it, so it is worth checking whether that value counts as an outlier before you report anything. If your data is skewed, report the median alongside the mean, as covered in our guide to mean vs median.
To compare spread between data sets with different scales, use the coefficient of variation, which is the standard deviation divided by the mean. The calculator shows it as a percentage.
Standard deviation, variance and standard error
Variance is the standard deviation squared, and our variance calculator shows it as the main result. It is what you get at the step before the square root, and it is in squared units, such as points squared. Statistical tests often work with variance, while reports usually quote the standard deviation.
Standard error is the standard deviation divided by the square root of n, and some books call it the standard deviation of the mean. It describes how precise your sample mean is, not how spread out the individual values are. For the test scores, s = 9.45 and the standard error is 9.45 / √10 = 2.99. Collect more data and the standard error shrinks, while the standard deviation stays about the same.
Standard deviation in Excel and Google Sheets
Both programs have a separate function for each version:
=STDEV.S(A2:A11) sample
=STDEV.P(A2:A11) population
Microsoft’s pages for STDEV.S and STDEV.P explain that both skip text and empty cells in a range. Google Sheets also accepts the older names STDEV and STDEVP, described in its STDEV help page. In our test of 20 data sets, Excel and Google Sheets returned matching results on every case we could compare, STDEV.S included.
If your rows are a sample, use STDEV.S. For 2, 4, 4, 4, 5, 5, 7 and 9, STDEV.P returns 2 and STDEV.S returns 2.1381, so the choice changes the answer even on a short list.
Why use this standard deviation calculator?
What you get with this free standard deviation calculator:
- Paste a column straight from Excel or Google Sheets, or type numbers separated by commas or spaces.
- Switch between sample and population and see both results, so you can check which one your teacher or report expects.
- Enter repeated values once with a frequency table instead of typing each one.
- Get the variance, sum of squares, standard error and coefficient of variation alongside the standard deviation.
- See each value’s distance from the mean and its z score, with a band marking one standard deviation.
- Follow a full table of x − x̄ and (x − x̄)² that you can copy into homework or a report.
- Free to use
- No sign-up
- Sample and population
- Frequency tables
- Step-by-step working
Frequently asked questions
How do you calculate standard deviation?
Find the mean, subtract it from each value, square the differences and add them up. Divide by n − 1 for a sample or N for a population, then take the square root.
Should I use sample or population standard deviation?
Use sample (s) when your data is part of a larger group you want to describe, which covers most homework, surveys and experiments. Use population (σ) only when you have every value in the group.
What is a good standard deviation?
There is no single good value. It depends on the scale of your data. A standard deviation of 5 is small for house prices in thousands and large for shoe sizes. The coefficient of variation helps compare spread across different scales.
Can standard deviation be negative?
No. It is a square root of a sum of squares, so the smallest it can be is 0, which happens when every value is the same.
Why is the sample standard deviation bigger than the population one?
Dividing by n − 1 instead of n makes the result slightly larger. This corrects for a sample sitting closer to its own mean than to the true population mean.
What is the difference between standard deviation and variance?
Variance is the average squared distance from the mean. Standard deviation is its square root, which puts it back in the original units of your data.
How do I find standard deviation in Excel?
Use =STDEV.S(range) for a sample or =STDEV.P(range) for a population. Both ignore text and blank cells in the range.
How do I find standard deviation on a TI-84?
Press STAT, choose 1:Edit and type your values into L1. Then press STAT, move to CALC and choose 1:1-Var Stats. Sx is the sample standard deviation and σx is the population standard deviation. Scroll the same screen down and it also prints minX, Q1, Med, Q3 and maxX, which is the five number summary.
What is the symbol for standard deviation?
A lowercase s is used for the sample standard deviation and the Greek letter σ (sigma) for the population standard deviation. The matching means are x̄ and μ, and the variances are s² and σ².
Does standard deviation have units?
Yes. It uses the same units as your data, so the standard deviation of heights measured in centimeters is also in centimeters. The variance is in squared units, such as cm².
Can I paste data from Excel or Google Sheets?
Yes. Copy a column and paste it into the box, and each cell becomes one value. In the Frequency table tab, paste two columns with the values first and the counts second.
Explore our other calculators
 Average calculator
 Average percentage calculator
 Average time calculator
 Degrees of freedom calculator
 Exponential Regression Calculator
 Five Number Summary Calculator
 Histogram maker
 IQR calculator
 Linear regression calculator
 Mean, Median, Mode and Range Calculator
 Outlier Calculator
 Pie Chart Maker
 Probability Calculator
 Sum of Squares Calculator
 Variance calculator
 Weighted average calculator
Our latest blogs
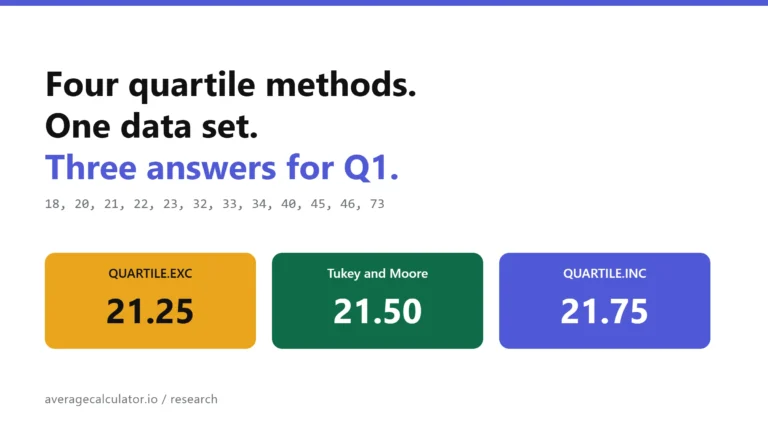
Four quartile methods, one data set, three answers for Q1
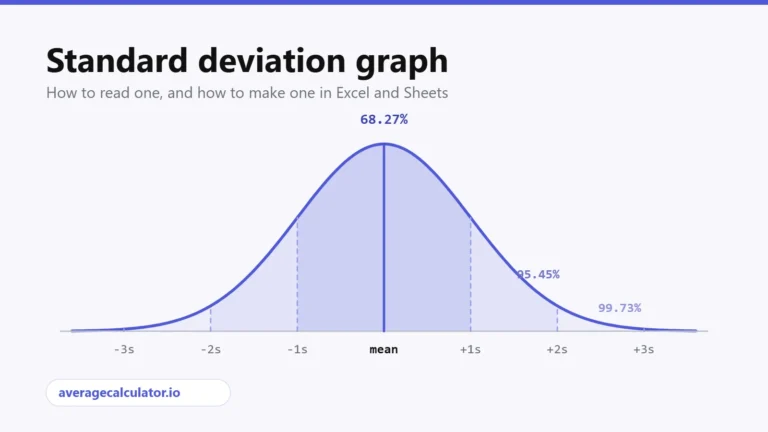
Standard deviation graph: how to read one and how to make one
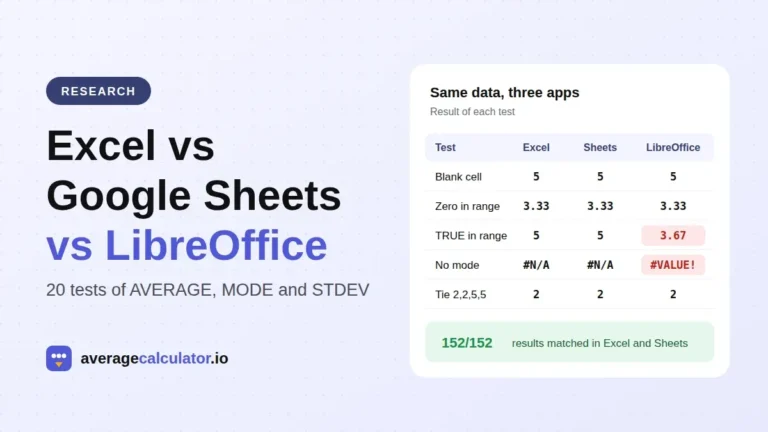
Excel vs Google Sheets vs LibreOffice: how average functions handle blanks, zeros and text
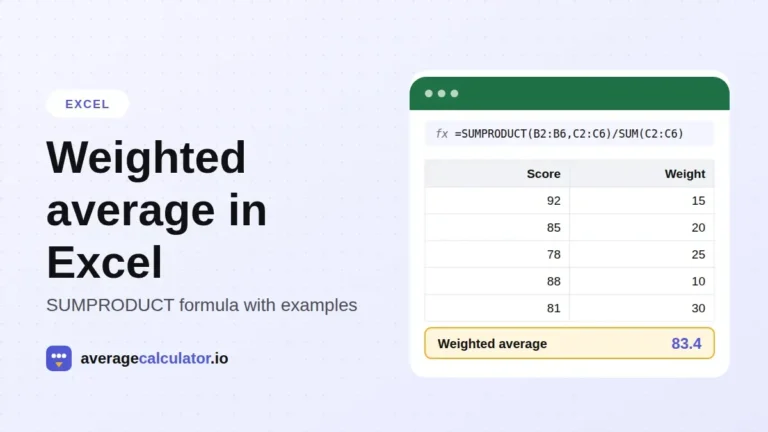
How to calculate a weighted average in Excel, with examples
Mean vs median: which average should you use?
Who made this calculator
Spotted a mistake in this calculator? Tell us the numbers you used and what you expected, and we will check it.
Report an error