
Variance calculator
Enter a list of numbers or a frequency table to find the sample or population variance, along with the mean, standard deviation and a step-by-step solution.

 By Paul Lewis · Reviewed by Ozlem Ozturk✓ Fact-checked
How to use the variance calculator
- 1Enter your data
Type or paste numbers separated by commas, spaces or new lines. A column copied from Excel or Google Sheets works too.
- 2Pick sample or population
Choose sample if your numbers are part of a bigger group. Choose population if you have every value in the group.
- 3Use a frequency table if you have counts
Switch tabs and enter each value with how many times it appears, such as 4 12.
- 4Press Calculate
You get the variance, standard deviation, mean, standard error and every step of the working.
Step-by-step solution
What is variance in statistics?
Variance measures how spread out a set of numbers is. It is the average of the squared distances between each value and the mean. If every value is the same, the variance is 0. The further the values sit from the mean, the larger it gets.
Because the distances are squared, variance is in squared units. Test scores in points give a variance in points squared, which is hard to picture. That is why reports usually quote the standard deviation, the square root of the variance, while statistical tests such as ANOVA work with the variance itself.
Variance formula
There is one formula for a sample and one for a population. They differ only in what you divide by.
Sample variance: s² = Σ(x − x̄)² / (n − 1)
Population variance: σ² = Σ(x − μ)² / N
x is each value, x̄ and μ are the sample and population means, and n and N are the number of values. The top of both fractions is the sum of squares, so once you have that, either version is one division away.
How to find variance
To find the variance of a data set by hand, work out the mean first, then measure how far each value is from it:
- Add the values and divide by how many there are to get the mean.
- Subtract the mean from each value.
- Square each result.
- Add the squares to get the sum of squares.
- Divide by n − 1 for a sample or by N for a population. That n − 1 is the degrees of freedom.
Worked example
Take the five values 2, 7, 3, 12 and 9.
- Mean: 33 / 5 = 6.6
- Differences from the mean: −4.6, 0.4, −3.6, 5.4, 2.4
- Squared: 21.16, 0.16, 12.96, 29.16, 5.76
- Sum of squares: 69.2
- Population variance: 69.2 / 5 = 13.84
- Sample variance: 69.2 / 4 = 17.3
Statistics Canada’s guide to calculating variance uses the same five numbers and divides by 5, which is the population version, to get 13.84. Paste the numbers into the calculator above and switch between sample and population to see both results.
Sample variance vs population variance
Use the sample variance when your numbers are part of a bigger group and you want to estimate the spread of that group. Survey answers from 200 people, 12 weeks of sales or one class out of a school are all samples. Most homework and research data falls here.
Use the population variance only when you have every value you care about, such as the scores of all 30 students in a class you are describing and nothing more.
The sample formula divides by n − 1 instead of n. A sample tends to sit a little closer to its own mean than to the true mean of the whole group, so dividing by n would make the variance too small. With the five values above, the sample variance is 17.3 against 13.84 for the population, a 25% difference. With 100 values the gap drops to about 1%.
The “Data set is” dropdown turns the tool into a sample variance calculator or a population variance calculator, and the results always show the other version too.
Variance of a frequency table
When values repeat, enter each one once with its count in the Frequency table tab. The formula multiplies each squared difference by its count f:
s² = Σf(x − x̄)² / (n − 1), where n = Σf
For 60 dice rolls where 1 to 6 came up 8, 11, 9, 12, 10 and 10 times, the mean is 3.5833, the sum of squares is 164.5833 and the sample variance is 164.5833 / 59 = 2.7895. Click “Dice rolls” in the calculator to see each step.
Variance vs standard deviation
They measure the same thing. The standard deviation is the square root of the variance, and the variance is the standard deviation squared. For the five values above, the sample variance is 17.3 and the sample standard deviation is √17.3 = 4.1593.
Use the standard deviation when you want to describe spread in the same units as the data, such as “the average score was 80 with a standard deviation of 9 points.” It is also the only one of the two you can draw on the same axis as the values, which is what a standard deviation graph does. Use the variance when you add up spread from different sources, because variances of independent variables add together and standard deviations do not. Our standard deviation calculator uses the same engine with the standard deviation as the main result.
How to calculate variance in Excel and Google Sheets
=VAR.S(A2:A11) sample
=VAR.P(A2:A11) population
Microsoft’s help pages for VAR.S and VAR.P describe the first as an estimate from a sample and the second as the variance of an entire population. Google Sheets accepts the same two names as well as the older VAR and VARP.
If your answer does not match a textbook, check which version the book used. For 2, 7, 3, 12 and 9, VAR.S returns 17.3 and VAR.P returns 13.84, so a gap like that usually means one of you used the other formula.
Why use this variance calculator?
What you get with this free variance calculator:
- Paste a column from Excel or Google Sheets, or type numbers separated by commas, spaces or new lines.
- Get the sample and population variance together, so you can match whichever one your course or report uses.
- Enter repeated values once with a frequency table.
- See the mean, standard deviation, sum of squares and standard error next to the variance.
- See which values add the most to the variance, as a share of the sum of squares, next to the full table of x − x̄ and (x − x̄)².
- Free to use
- No sign-up
- Sample and population
- Frequency tables
- Step-by-step working
Frequently asked questions
How do you calculate variance?
Find the mean, subtract it from each value, square the differences and add them up. Divide that total by n − 1 for a sample or by N for a population.
How do I find the sample variance?
Use the same steps but divide the sum of squares by n − 1. For 2, 7, 3, 12 and 9, the sum of squares is 69.2, so the sample variance is 69.2 / 4 = 17.3.
Can variance be negative?
No. It is built from squared differences, which are never negative, so the smallest possible variance is 0. A negative result means there is a mistake in the working.
What does a variance of 0 mean?
Every value in the data set is the same, so nothing varies from the mean.
Why does sample variance divide by n − 1?
A sample sits closer to its own mean than to the mean of the whole population, so dividing by n would understate the spread. Dividing by n − 1, called Bessel’s correction, fixes this on average.
What are the units of variance?
The units of your data squared. Heights in centimeters give a variance in square centimeters. Take the square root to get back to centimeters with the standard deviation.
How do I find variance on a TI-84?
Enter your data in L1 with STAT and 1:Edit, then run STAT, CALC, 1:1-Var Stats. The TI-84 shows the standard deviation (Sx for a sample, σx for a population) but not the variance, so square that number to get it.
How do I calculate variance in Excel?
Use =VAR.S(range) for a sample and =VAR.P(range) for a population.
Explore our other calculators
 Average calculator
 Average percentage calculator
 Average time calculator
 Degrees of freedom calculator
 Exponential Regression Calculator
 Five Number Summary Calculator
 Histogram maker
 IQR calculator
 Linear regression calculator
 Mean, Median, Mode and Range Calculator
 Outlier Calculator
 Pie Chart Maker
 Probability Calculator
 Standard deviation calculator
 Sum of Squares Calculator
 Weighted average calculator
Our latest blogs
Four quartile methods, one data set, three answers for Q1
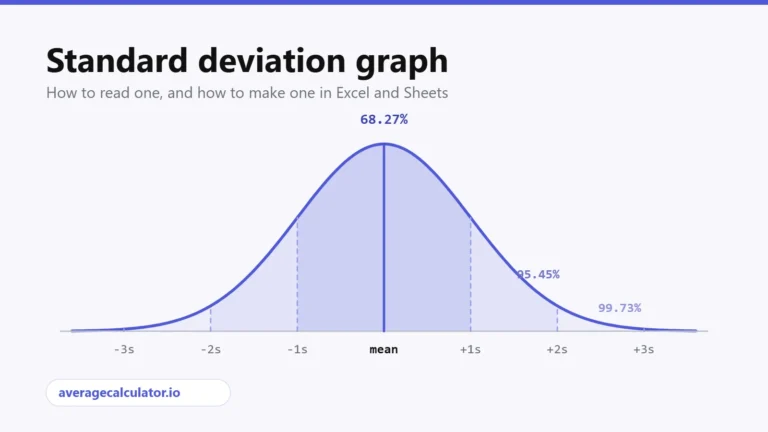
Standard deviation graph: how to read one and how to make one
Excel vs Google Sheets vs LibreOffice: how average functions handle blanks, zeros and text
How to calculate a weighted average in Excel, with examples
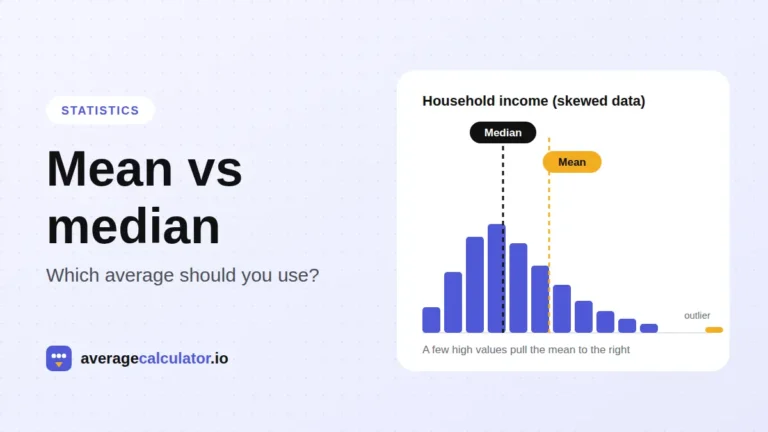
Mean vs median: which average should you use?
Who made this calculator
Spotted a mistake in this calculator? Tell us the numbers you used and what you expected, and we will check it.
Report an error