
Mean, median, mode and range calculator
Paste your numbers and get all four at once, each with its own working shown step by step. Frequency tables and grouped class intervals work the same way.

 By Susan Simmons · Reviewed by Michael O'Brien✓ Fact-checked
How to use the mean calculator
- 1Enter your numbers
Type or paste them separated by commas, spaces or new lines. A column copied from Excel or Google Sheets works too.
- 2Or use a frequency table
If values repeat, switch tabs and enter each value with how many times it appears, such as 4 12.
- 3Grouped data works too
For class intervals, use the Grouped data tab and enter rows like 10-20 5. The calculator uses the midpoint of each class.
- 4Press Calculate
You get the mean, median, mode, range and the full working, plus quartiles, standard deviation and outliers.
Step-by-step solution
What the mean, median, mode and range each tell you
Three of these are averages and one is not. The mean, median and mode are three different answers to the question “what is a typical value here”. The range answers a different question entirely: how far apart the values are, and if you want that answered more carefully than one number manages, the five number summary adds the two quartiles so a single extreme value cannot stretch the whole picture.
| Measure | What it is | Best when | Weak when |
|---|---|---|---|
| Mean | The total divided by how many values there are | Values are fairly evenly spread | One or two extreme values drag it away from the middle |
| Median | The middle value once the numbers are in order | The data is skewed or has outliers | You need every value to count towards the answer |
| Mode | The value that appears most often | Data is categories or repeated whole numbers | Nothing repeats, or several values tie |
| Range | The largest value minus the smallest | You want a one-number feel for the spread | Only the two end values matter, so one outlier decides it |
Homework questions usually ask for all four together because comparing them is the point. When the mean and the median are close, the data is reasonably symmetric. When they pull apart, something is stretching one tail, and the gap between them is the clue. An outlier test will usually tell you whether a single extreme value is doing the stretching.
How to find the mean
Add every value, then divide by how many values there are.
Mean = Σx ÷ n
Take ten support tickets that took 3, 5, 5, 6, 7, 8, 5, 9, 12 and 20 minutes to close. They add to 80, and 80 divided by 10 is a mean of 8 minutes. Plain numbers like these are easy. If your times are written as 7:42 or 1:30, the average time calculator does the clock arithmetic for you.
The mean uses every value, which is its strength and its weakness. That one 20 minute ticket is pulling the answer upwards on its own. Drop it and the remaining nine average 6.67 minutes. Nothing else in the set changed.
The symbol changes depending on what your data represents. A sample mean is written x̄ and a population mean is written μ. The arithmetic is identical, so the switch at the top of the calculator only changes the labels and the spread statistics underneath, never the mean itself.
How to find the median
Put the numbers in order first. That step is not optional, and skipping it is the most common way median questions go wrong.
- Sort the values from smallest to largest.
- If the count is odd, the median is the single value in the middle.
- If the count is even, take the two middle values and average them.
The same ten tickets sorted are 3, 5, 5, 5, 6, 7, 8, 9, 12, 20. Ten is even, so the middle two are the fifth and sixth values, 6 and 7. Their average is 6.5, and that is the median.
For a quick position check with an odd count, the median sits at position (n + 1) ÷ 2. With 15 values that is position 8. With an even count the same formula lands between two positions, which is exactly the case where you average the pair.
Notice what the 20 did to the median: nothing. Swap it for 200 and the middle two values are still 6 and 7. That resistance to extreme values is the whole reason the median exists as a separate measure.
How to find the mode
Count how many times each value appears. Whichever appears most often is the mode. There is no formula, only counting, which is why sorting the list first makes it much easier to see.
In 3, 5, 5, 5, 6, 7, 8, 9, 12, 20 the value 5 appears three times and everything else appears once. The mode is 5.
The mode is the only one of the four that can misbehave in two opposite directions, and exam questions lean on both.
- No mode at all. If every value appears exactly once, there is no mode. Writing 0 is wrong, and so is picking the largest value. The correct answer is that the set has no mode.
- More than one mode. If two values tie for most frequent, both are modes and the set is bimodal. Three or more and it is multimodal. You list them all rather than choosing one.
The mode is also the only one of the four that works on things that are not numbers. You cannot take the mean of a list of eye colours, but you can say which colour came up most often. That is why survey and category data usually gets reported by mode, and why a pie chart is often the clearest way to show it.
How to find the range
Subtract the smallest value from the largest.
Range = largest value − smallest value
For the tickets that is 20 minus 3, so the range is 17 minutes.
Two things about the answer. It is a single number, not a pair, so “3 to 20” is describing the data rather than answering the question. And the range is always zero or positive, because the largest value cannot be below the smallest.
The range is the crudest measure of spread there is, because only two values in the whole set have any say in it. Replace that 20 minute ticket with a 90 minute one and the range jumps from 17 to 87 while nine of the ten values sit exactly where they were. When one extreme value is distorting things, the interquartile range or the standard deviation describes the spread far more honestly, and the calculator returns both underneath.
All four on one data set
Ten support tickets, closed in 3, 5, 5, 6, 7, 8, 5, 9, 12 and 20 minutes.
| Measure | Working | Answer |
|---|---|---|
| Mean | 80 ÷ 10 | 8 minutes |
| Median | middle two of the sorted list, (6 + 7) ÷ 2 | 6.5 minutes |
| Mode | 5 appears three times | 5 minutes |
| Range | 20 − 3 | 17 minutes |
Three different answers to “how long does a ticket usually take”, and all three are correct. The mode says 5 minutes because that is the single most common outcome. The median says 6.5 because half the tickets finish faster than that. The mean says 8 because it is carrying the weight of that one slow ticket.
Mean 8, median 6.5, mode 5. When the three line up in that order, largest to smallest, the data is skewed to the right: a long tail of high values with most of the data bunched at the low end. Reverse the order and the tail runs the other way. If all three sit close together, the distribution is roughly symmetric. A histogram of the same numbers shows that shape directly.
Which average should you use?
The honest test is whether a handful of extreme values would change your answer in a way that misleads the reader.
Income is the standard example, and the Census Bureau’s own choice makes the point. Its annual report Income in the United States: 2024 leads with the median, putting household income at $83,730. It reports the median rather than the mean because income has a long right tail: a small number of very high earners pull the mean upwards, so the mean would sit above what most households actually experience. The median stays put in the middle no matter how large the largest income is.
Rough guide for choosing:
- Mean for symmetric data with no extreme values, and whenever you need the total back out of the average. Only the mean multiplies by n to return the sum.
- Median for income, house prices, waiting times, response times, and anything else with a long tail.
- Mode for categories, shoe sizes, survey answers, and any data where the most common outcome is the useful fact.
When values carry different importance rather than counting equally, none of these three is the right tool and you want a weighted average instead.
Mean, median and mode from a frequency table
When values repeat, the data usually arrives as a frequency table rather than a long list. Twenty households surveyed on how many cars they own:
| Cars (x) | Households (f) | f × x | Running total of f |
|---|---|---|---|
| 0 | 2 | 0 | 2 |
| 1 | 7 | 7 | 9 |
| 2 | 8 | 16 | 17 |
| 3 | 3 | 9 | 20 |
| Total | 20 | 32 |
The mean is the f times x column divided by the total frequency, so 32 divided by 20, which is 1.6 cars.
For the median, the running total column does the work. There are 20 households, so the median sits between the tenth and eleventh. The running total reaches 9 after the one car group and 17 after the two car group, so both the tenth and the eleventh household are in the two car group. The median is 2.
The mode is the value with the largest frequency, which is 2 cars with 8 households. Read the frequency column, not the value column: a common slip is to answer 8, which is how many households there are rather than what they own.
The range is 3 minus 0, so 3 cars. Paste the table into the Frequency table tab above as two columns and all four come out with the working attached.
Mean, median and mode from grouped data
Grouped data gives you class intervals instead of individual values, so the original numbers are gone. Everything you calculate from here is an estimate, and exam mark schemes expect you to say so.
Sixteen deliveries sorted into three time bands: 10 to 20 minutes with 5 deliveries, 20 to 30 with 8, and 30 to 40 with 3.
The method is to treat every value in a class as if it sat at the class midpoint. The midpoints are 15, 25 and 35. Multiply each by its frequency and add: 15 times 5 plus 25 times 8 plus 35 times 3 gives 380. Divide by 16 and the estimated mean is 23.75 minutes.
The modal class is the one with the highest frequency, which is 20 to 30. For grouped data you name the class, not a single number, unless the question specifically asks for an estimate from the midpoint.
The grouped median has two accepted methods and they do not always agree. Using midpoints, the tenth and eleventh values both fall in the 20 to 30 class and the estimate is its midpoint, 25. Using the interpolation formula, you get 20 plus (8 minus 5) divided by 8, times the class width of 10, which is 23.75. Both are defensible, but check which one your course uses before you write an answer down. The calculator above uses the midpoint method.
The grouped range uses the class limits rather than the midpoints, so 40 minus 10 gives 30 minutes.
How to find all four in Excel and Google Sheets
Three of the four have a function. The range does not, so you build it from two.
=AVERAGE(A1:A10) gives the mean
=MEDIAN(A1:A10) gives the median
=MODE.SNGL(A1:A10) gives the mode
=MAX(A1:A10)-MIN(A1:A10) gives the range
MODE.SNGL returns one value even when the data is bimodal, and it picks whichever mode it meets first. For data with ties, MODE.MULT returns all of them, entered across enough cells to hold the answers. Google Sheets uses plain MODE for the single version and also supports MODE.MULT.
Watch what happens with no mode at all. If every value in the range appears exactly once, MODE.SNGL returns the N/A error rather than a blank or a zero, which surprises people who assume something went wrong with the formula. Nothing did. The error is the correct answer, and wrapping it in IFERROR to display “No mode” reads better in a report.
AVERAGE and MEDIAN both skip empty cells and text, but they treat a cell holding zero as a real value, because it is one. A blank and a zero give different answers, so check which you have before trusting the result.
Where these questions go wrong
- Finding the median without sorting. The middle of the list as typed is not the median. Sort first, every time.
- Answering 0 when there is no mode. No mode means no mode. Zero is a value, and claiming it appeared most often is a different statement.
- Giving the range as two numbers. “3 to 20” is the spread described. The range is 17.
- Reading the frequency instead of the value. In a frequency table the mode is the value that repeats most, not the count of how often it repeated.
- Forgetting to average the middle pair. With an even count the median usually is not one of the values in your data, and that is normal.
- Calling a grouped answer exact. Once the raw values are gone, the mean and median from class intervals are estimates and should be written as estimates.
One quick check catches several of these at once. The median must sit somewhere between the smallest and largest values, and so must the mean. If either falls outside that window, the arithmetic went wrong before you got to the answer.
Why use this mean, median, mode and range calculator?
What you get with this free mean median mode range calculator:
- All four answers side by side rather than one at a time, so you can see straight away whether the mean and median agree.
- The working for each one written out, including the sorted list and which positions the median came from.
- Every mode listed when the data is bimodal, and a plain “None” rather than an error when nothing repeats.
- Frequency tables and grouped class intervals handled in their own tabs, with grouped results labelled as estimates.
- Quartiles, interquartile range, standard deviation and variance underneath, for when the range is too crude.
- A sample and population switch that changes only what should change.
- Commas, spaces, tabs or line breaks all accepted, so a column pasted from a spreadsheet works unchanged.
- Free to use
- No sign-up
- All four at once
- Full working shown
- Frequency and grouped data
Frequently asked questions
How do you find the mean, median, mode and range?
Mean: add the values and divide by how many there are. Median: sort them and take the middle, averaging the middle two if the count is even. Mode: the value that appears most often. Range: largest minus smallest. For 3, 5, 5, 6, 7, 8, 5, 9, 12, 20 that gives 8, 6.5, 5 and 17.
What is the difference between the mean and the median?
The mean uses every value, so one extreme number moves it. The median only cares about position, so it stays where it is. When the two are far apart the data is skewed, and the median usually describes a typical value better.
What if there is no mode?
Then the set has no mode, and that is the answer to write. It happens whenever every value appears exactly once. Do not answer 0 and do not pick the largest or most recent value.
Can a data set have two modes?
Yes. If two values tie for most frequent, both are modes and the set is bimodal. Three or more is multimodal. List every tied value rather than choosing between them. The calculator shows all of them.
Is the range an average?
No. The mean, median and mode are averages, which describe a typical value. The range measures spread, which is how far apart the values are. They answer different questions, which is why homework asks for both.
Do I have to put the numbers in order?
For the median, yes, always. For the mode, sorting is not required but it makes the repeats obvious. For the mean and the range, order makes no difference at all.
What does it mean when the mean is higher than the median?
The data is skewed to the right, with a tail of high values pulling the mean up. Income and waiting times behave this way. When the mean sits below the median, the tail runs the other way.
How do I find the mean, median and mode in Excel?
Use =AVERAGE(A1:A10), =MEDIAN(A1:A10) and =MODE.SNGL(A1:A10). There is no range function, so use =MAX(A1:A10)-MIN(A1:A10). If nothing repeats, MODE.SNGL returns an N/A error, which is the correct result rather than a fault.
Explore our other calculators
 Average calculator
 Average percentage calculator
 Average time calculator
 Degrees of freedom calculator
 Exponential Regression Calculator
 Five Number Summary Calculator
 Histogram maker
 IQR calculator
 Linear regression calculator
 Outlier Calculator
 Pie Chart Maker
 Probability Calculator
 Standard deviation calculator
 Sum of Squares Calculator
 Variance calculator
 Weighted average calculator
Our latest blogs
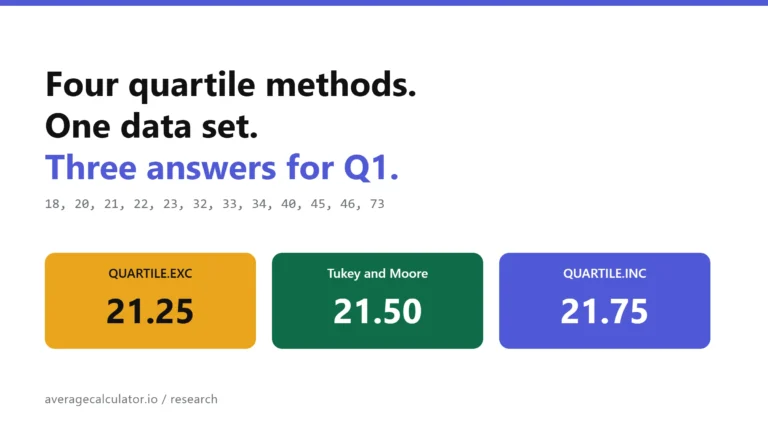
Four quartile methods, one data set, three answers for Q1
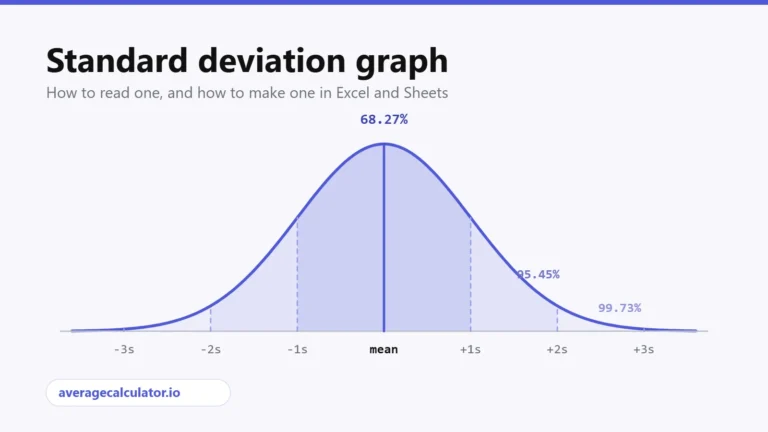
Standard deviation graph: how to read one and how to make one

Excel vs Google Sheets vs LibreOffice: how average functions handle blanks, zeros and text
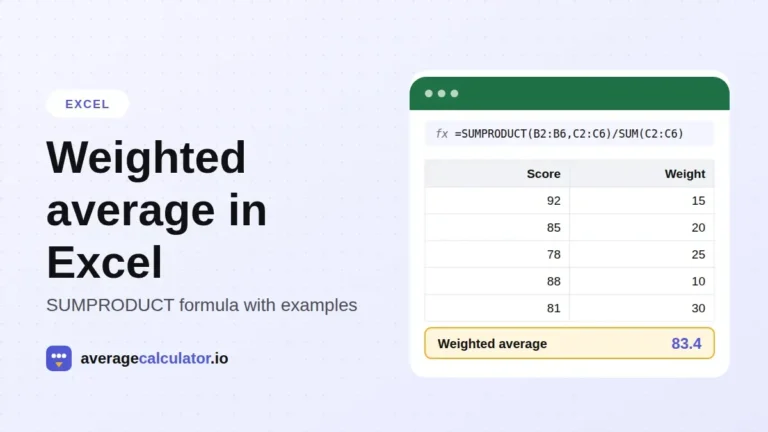
How to calculate a weighted average in Excel, with examples
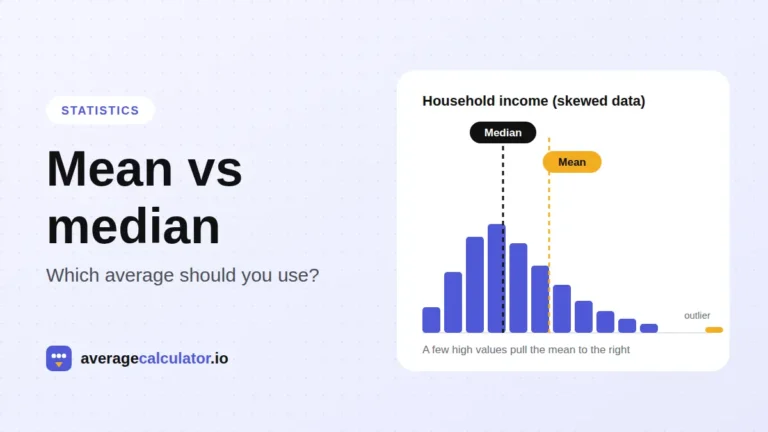
Mean vs median: which average should you use?
Who made this calculator
Spotted a mistake in this calculator? Tell us the numbers you used and what you expected, and we will check it.
Report an error