
Sum of squares calculator
Paste your data to get the sum of squares with every deviation shown, plus SST, SSR and SSE for regression, the between and within split for ANOVA, and the first n squares.

 By Ozlem Ozturk · Reviewed by Paul Lewis✓ Fact-checked
How to use the sum of squares calculator
- 1Pick what you need
Deviations is the sum of squares from a statistics course. Raw squares is plain x squared added up. The other three cover regression, ANOVA and the 1 squared plus 2 squared series.
- 2Paste your data
Commas, spaces, tabs or one number per line all work, so a column copied out of Excel or Google Sheets goes straight in.
- 3Press Calculate
You get the answer, the formula it came from, and a table showing every intermediate value.
- 4Copy the working
The step by step section underneath is written the way a marker expects to see it, so you can transfer it into your answer.
How this was worked out
What is the sum of squares?
The sum of squares measures how spread out a set of numbers is. You take each value, work out how far it sits from the mean, square that distance, and add all the squares together. The result is written SS.
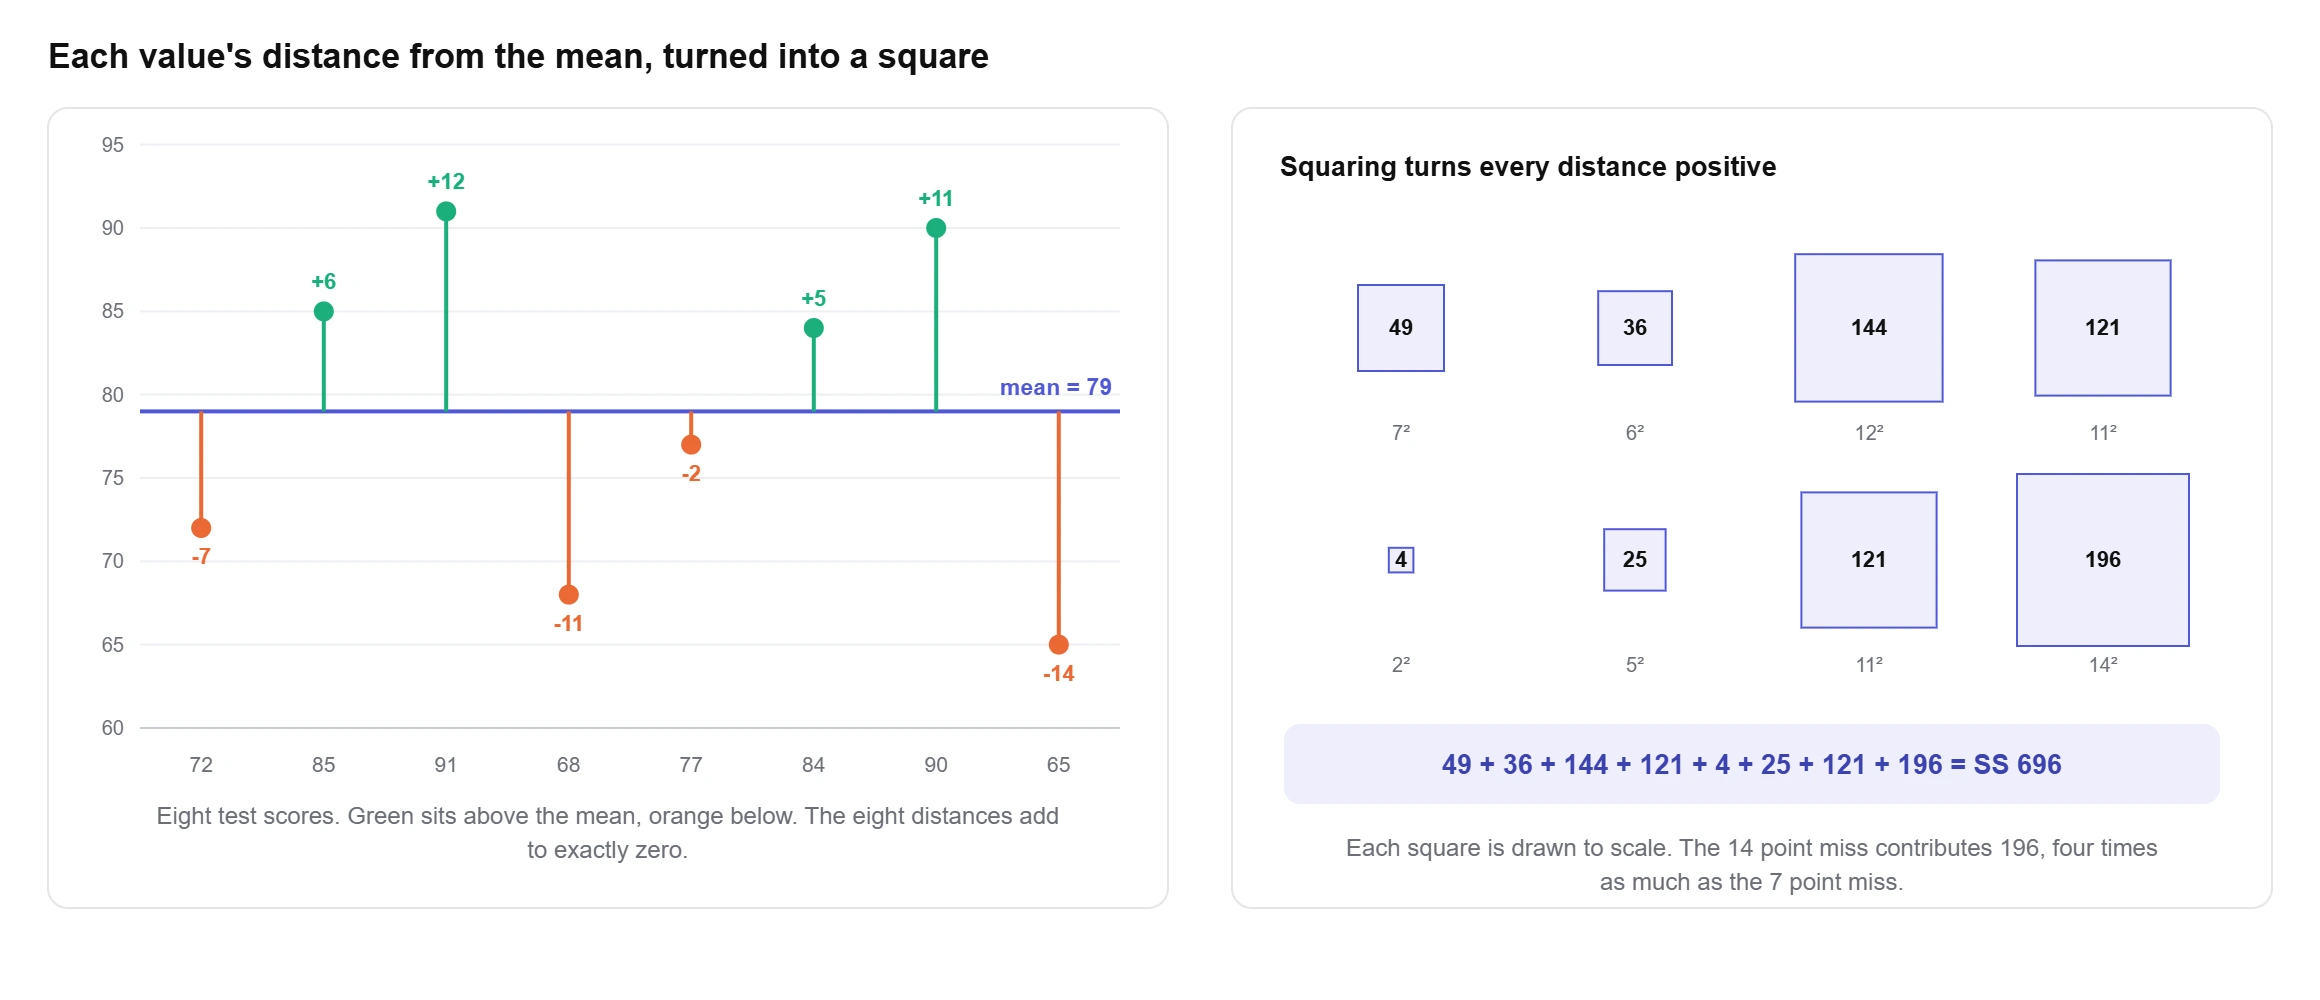
Eight test scores of 72, 85, 91, 68, 77, 84, 90 and 65 have a mean of 79. The score of 91 is 12 above the mean and 65 is 14 below it. Square all eight distances, add them, and the sum of squares is 696.
On its own that number is hard to interpret, because it grows with the size of the dataset. Its real job is to be the numerator of almost everything else in statistics. Divide 696 by 7 and you get the sample variance of 99.43. Take the square root of that and you have the standard deviation of 9.97. Variance, standard deviation, regression and ANOVA all start here.
Why squares, and not just the distances?
Add the raw distances from the mean and you always get exactly zero. That is not a coincidence, it is the definition of the mean: the positives and the negatives cancel by construction. Our eight scores give +12, +6, +5, +11, then -7, -11, -2, -14, and those add to nothing at all.
Squaring fixes the cancelling, and it does one more thing. It weights big misses much more heavily than small ones. A value 10 away from the mean contributes 100, while a value 2 away contributes 4. Absolute values would also stop the cancelling, but they treat those two the same, and they give you a quantity with no clean algebra behind it. Squares give you a function you can differentiate, which is exactly why least squares regression exists in the form it does.
The sum of squares formula
There are two formulas and they give the same answer. Which one you use depends on whether you are explaining the idea or doing the arithmetic.
Definitional: SS = Σ(xi − x̄)2
Computational: SS = Σx2 − (Σx)2 ÷ n
The first one says what the sum of squares is. The second one is how you actually work it out by hand, because it never asks you to write down the mean or subtract it eight times. You only need two running totals: the sum of the values and the sum of the squared values.
For the same eight scores, Σx is 632 and Σx² is 50,624. So SS is 50,624 minus 632 squared over 8, which is 50,624 minus 49,928, which is 696. Identical to the long route, with far fewer chances to slip.
Watch the brackets in that second formula. Σx² means square each value then add, and it is 50,624 here. (Σx)² means add first then square, and it is 399,424. Those are not close, and swapping them is the mistake that ruins more sum of squares questions than any other.
One warning about the computational formula. On very large numbers that are all close together, the two terms it subtracts are nearly equal, and the answer can lose precision. Spreadsheets and this calculator handle that internally, but if you are working with something like eight readings all around 1,000,000, use the definitional formula instead.
How to calculate the sum of squares
Four steps, using the eight test scores from above.
- Add the values and divide by how many there are. 632 divided by 8 gives a mean of 79.
- Take the mean away from each value. That gives -7, 6, 12, -11, -2, 5, 11 and -14.
- Square each of those. 49, 36, 144, 121, 4, 25, 121 and 196.
- Add the squares. The sum of squares is 696.
Before you square anything, add the deviations from step two. If they do not come to zero, your mean is wrong or you have mis-subtracted somewhere, and it is much easier to find that now than after eight squarings. The calculator prints that column with its total for the same reason.
What you do with 696 next depends on the question. Divided by n minus 1 it is the sample variance. Divided by n it is the population variance. Left alone it is the quantity ANOVA and regression tables are built from, which is why the sum of squares turns up as a column in output from software that never shows you a standard deviation at all.
Total, regression and error sums of squares
In regression the sum of squares splits into two parts, and the three quantities that come out of that split are SST, SSR and SSE. Textbooks and software disagree about the letters, which is most of why this topic is confusing, so here is the map first.
| Name | Formula | What it measures | Also called |
|---|---|---|---|
| SST | Σ(y − ȳ)² | All the variation in y there is to explain | SSTO, total sum of squares |
| SSR | Σ(ŷ − ȳ)² | The part the line does explain | SSM, ESS, explained sum of squares |
| SSE | Σ(y − ŷ)² | The part left over | RSS, residual sum of squares |
The trap is that SSE and SSR both get abbreviated to things starting with R in different books. In econometrics, RSS usually means the residual sum of squares, which is SSE here. In some regression texts, RSS means the regression sum of squares, which is the opposite. Read the formula, not the acronym.
Whatever you call them, they add up. Penn State’s regression course states it plainly in its ANOVA table lesson: the sums of squares add up, SSTO equals SSR plus SSE. That identity holds for every least squares fit, which makes it the fastest check you have.
A worked regression example
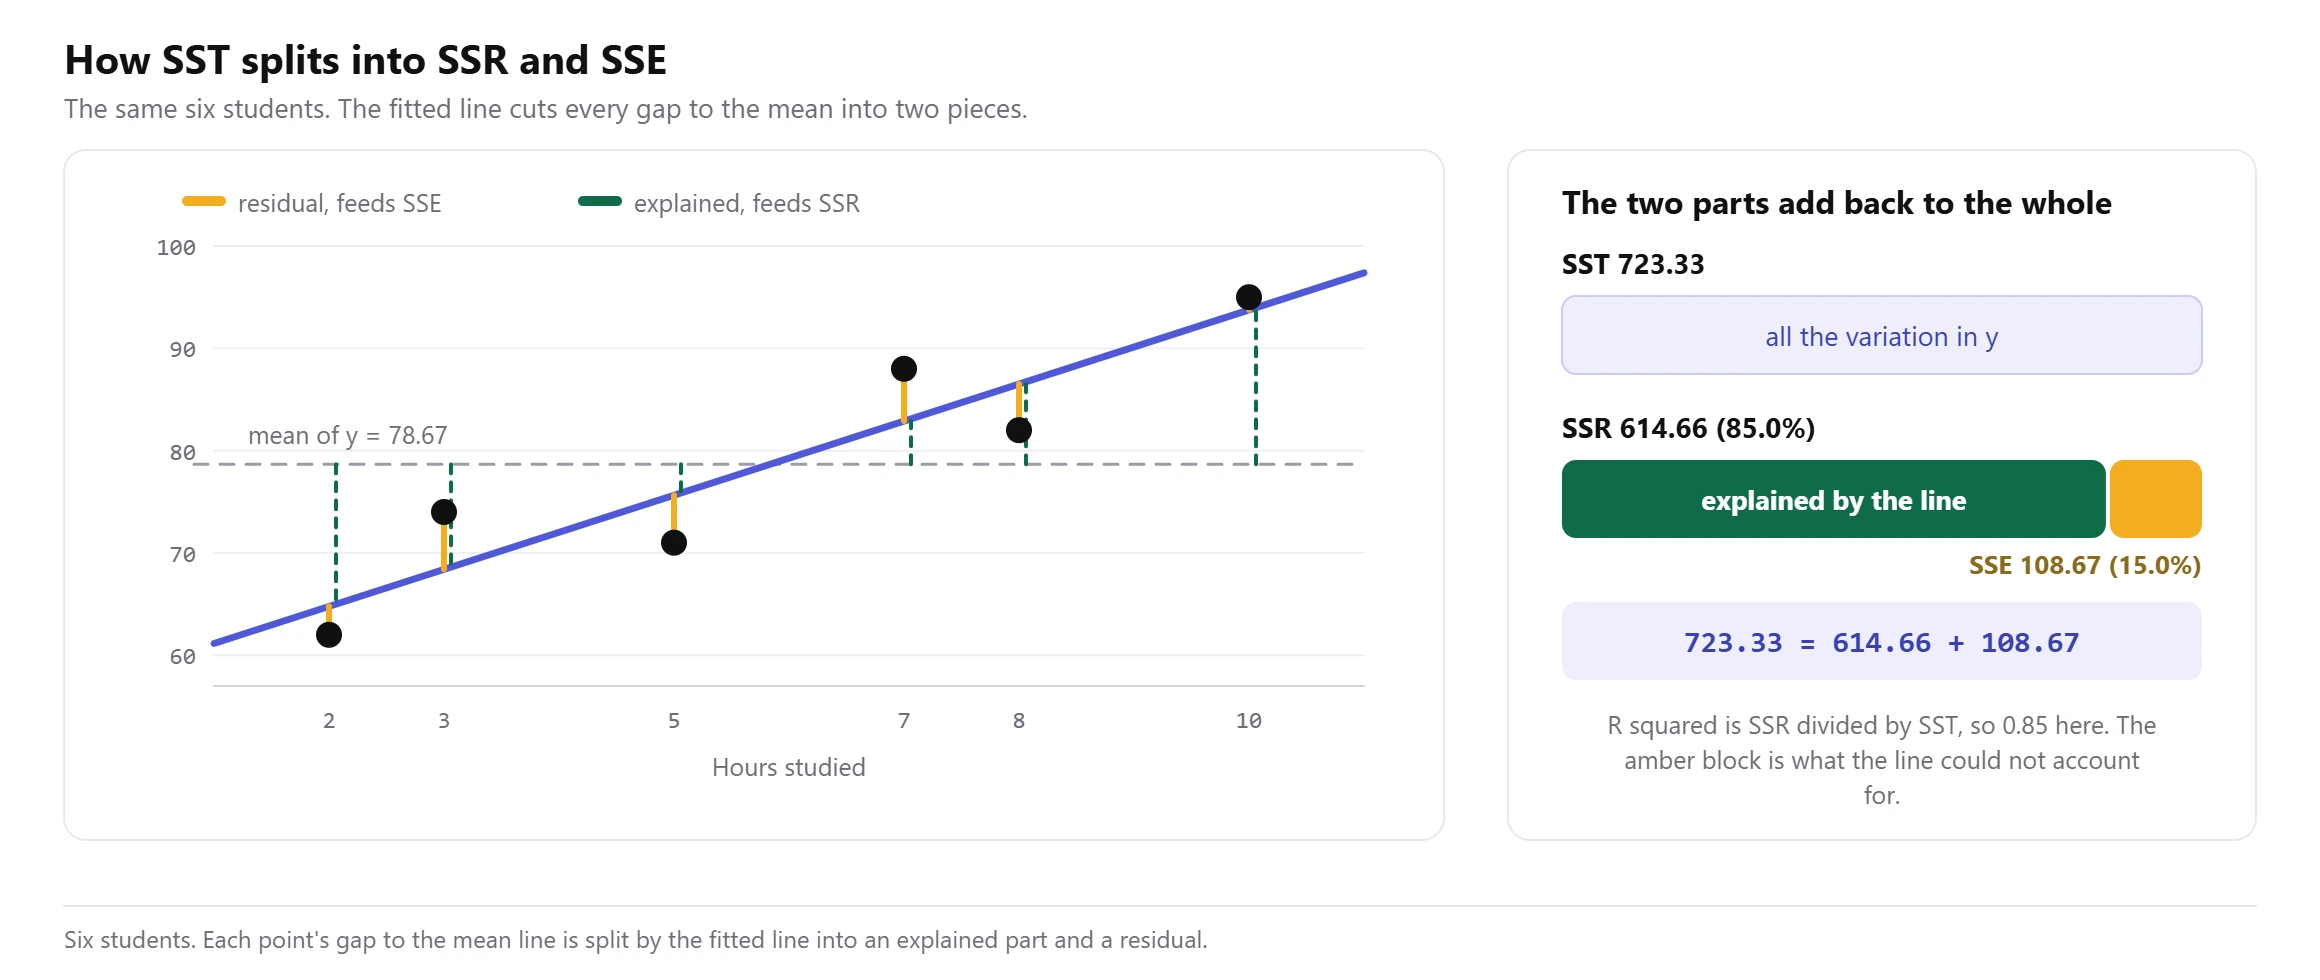
Six students, hours studied against exam score: 2 and 62, 3 and 74, 5 and 71, 7 and 88, 8 and 82, 10 and 95. The least squares line comes out as y = 57.53 + 3.62x, so roughly 3.6 extra marks per hour of study.
The mean score is 78.67. Squaring each score’s distance from that mean and adding gives SST of 723.33. Squaring each predicted score’s distance from the same mean gives SSR of 614.66. The residuals, squared and added, give SSE of 108.67. Add SSR and SSE together and you are back at 723.33.
R squared is just SSR divided by SST, so 614.66 over 723.33, which is 0.85. Hours studied accounts for 85% of the variation in these scores, and the other 15% is everything else going on in six students’ lives that a single straight line was never going to capture.
Sum of squares in ANOVA: between and within groups
ANOVA splits the total the same way, but along a different line. Instead of asking how much a fitted line explains, it asks how much the grouping explains.
Between groups: SSB = Σni(x̄i − x̄)2
Within groups: SSW = ΣΣ(x − x̄i)2
SST = SSB + SSW
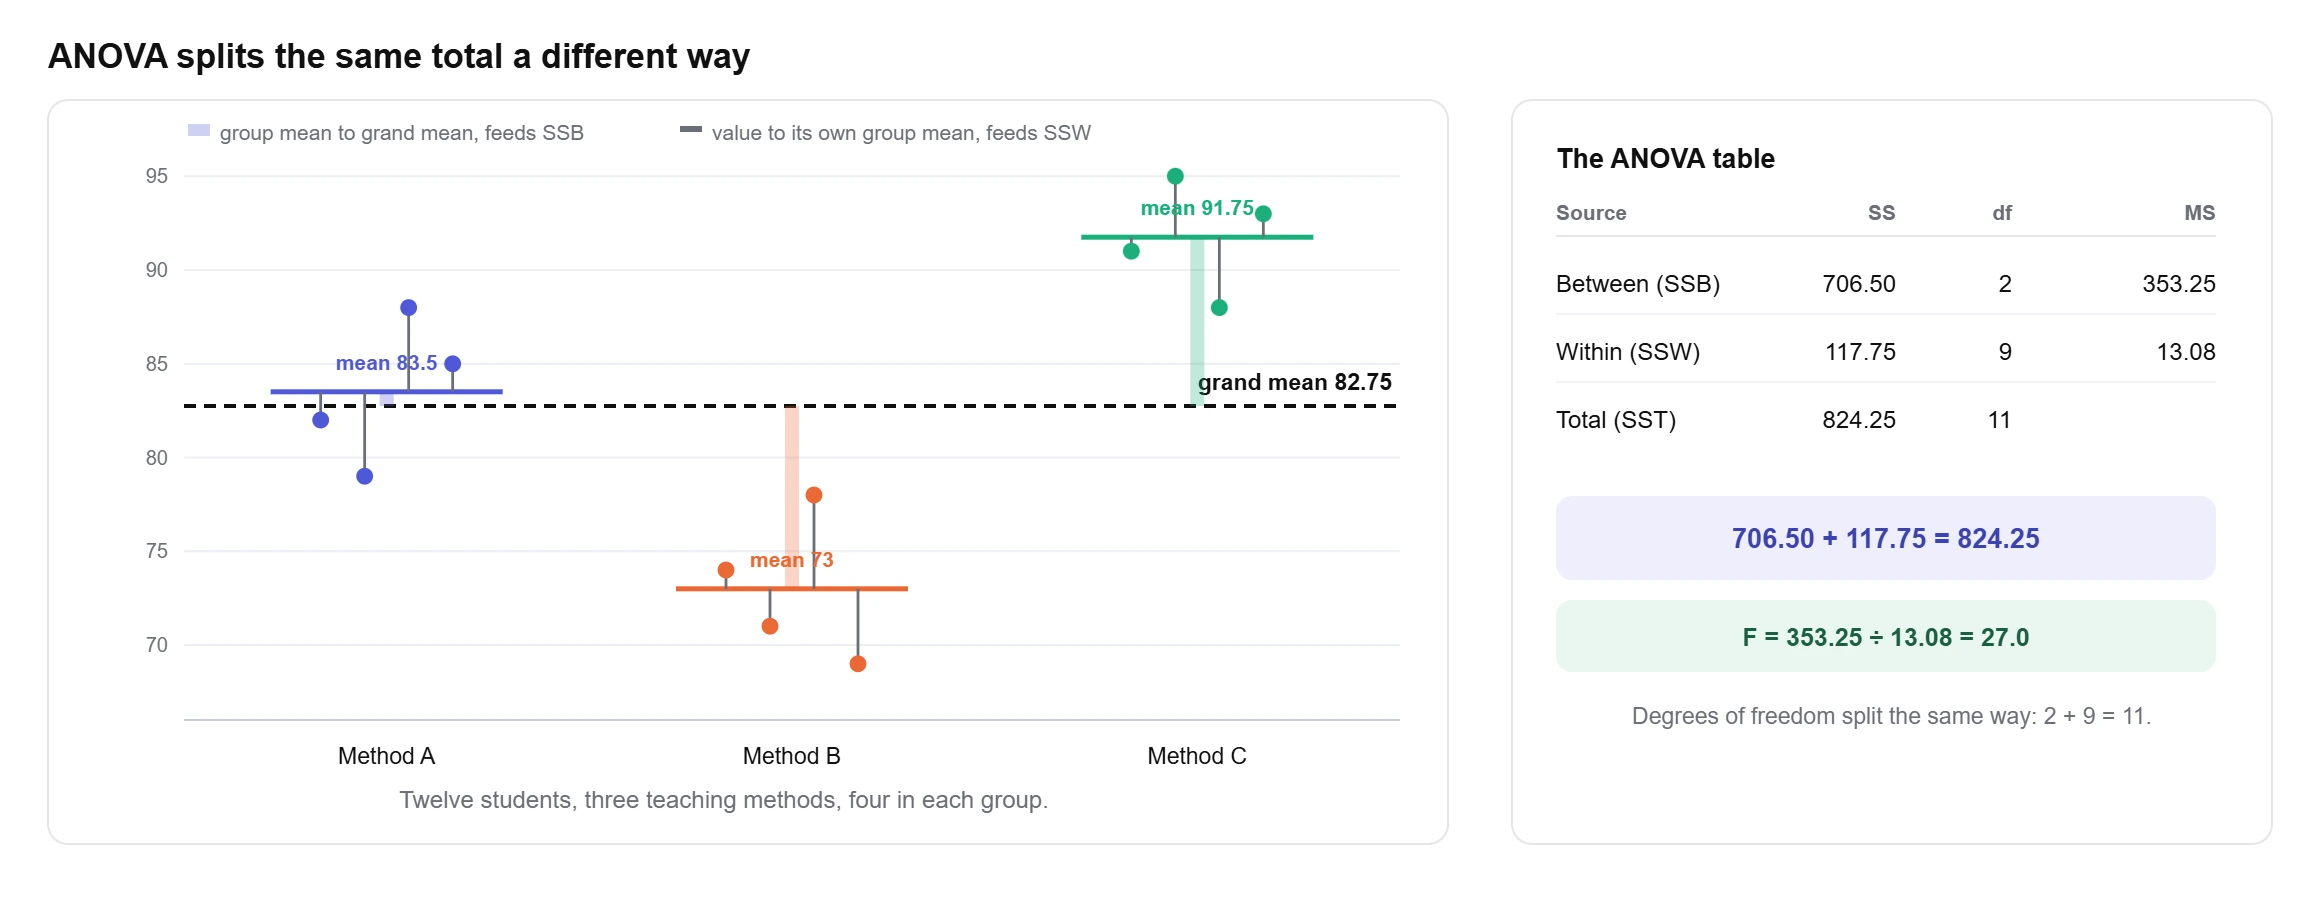
Twelve students taught three ways, four in each group. Method A scores 82, 79, 88, 85. Method B scores 74, 71, 78, 69. Method C scores 91, 95, 88, 93. The grand mean of all twelve is 82.75, and the group means are 83.5, 73 and 91.75.
SSB asks how far each group mean sits from 82.75, squared, weighted by group size. Method B is 9.75 below the grand mean, and 4 times 9.75 squared is 380.25. Doing that for all three gives SSB of 706.5. SSW is the ordinary sum of squares inside each group around its own mean: 45, 46 and 26.75, so SSW is 117.75. Together they make 824.25, which is the total sum of squares of all twelve scores.
Two things trip people up here. The grand mean is the mean of every value, not the average of the group means, and those only agree when the groups are the same size. And SSB must be weighted by n. Leaving the weight out is the single most common ANOVA arithmetic error, and it is invisible until your F ratio comes out wrong.
From there the degrees of freedom split the same way as the sums of squares: 2 between, 9 within, 11 in total. Dividing each sum of squares by its own degrees of freedom gives the mean squares, 353.25 and 13.08, and their ratio is the F statistic of 27.
Sum of the squares of the first n natural numbers
This is a different question that shares the same name, and it is the one algebra courses mean. Add 1 squared, 2 squared, 3 squared and so on up to n squared. There is a closed form, so you never have to add the terms.
12 + 22 + … + n2 = n(n + 1)(2n + 1) ÷ 6
At n = 10 that is 10 times 11 times 21 over 6, which is 2,310 over 6, so 385. At n = 14 it is 14 times 15 times 29 over 6, giving 1,015. At n = 100 the formula gives 338,350 in one line, and adding a hundred terms by hand would take considerably longer.
The product n(n + 1)(2n + 1) is always divisible by 6, which is worth knowing as a check: if your answer is not a whole number, the arithmetic went wrong somewhere.
For a range that does not start at 1, work out the sum up to the top of the range and subtract the sum up to just below the bottom. The squares from 5 to 12 are the sum up to 12, which is 650, minus the sum up to 4, which is 30, so 620. The First n squares tab above does that subtraction for you.
How to calculate the sum of squares in Excel and Google Sheets
Most people build this by hand with a helper column, and both programs have had a one-cell function for it the whole time.
=DEVSQ(A1:A8) gives the sum of squared deviations from the mean
=SUMSQ(A1:A8) gives the sum of the raw squares
DEVSQ is the statistics one. Google’s documentation for the DEVSQ function describes it as calculating the sum of squares of deviations based on a sample, and Excel’s version behaves identically. Put the eight test scores in A1 to A8 and =DEVSQ(A1:A8) returns 696 straight away.
SUMSQ is the algebraic one. It squares each value as it stands and adds them, so the same eight scores return 50,624. The two functions answer different questions and the names do not make that obvious, which is worth pausing on before you pick one.
Neither program has a function for SST, SSR and SSE. For those, run Data Analysis and then Regression in Excel and read them from the ANOVA table it produces, or paste your two columns into the Regression tab above.
Where sum of squares questions go wrong
- Confusing Σx² with (Σx)². For the eight scores those are 50,624 and 399,424. Both appear in the computational formula, so the brackets are carrying real weight.
- Rounding the mean before subtracting. A mean of 14.98 instead of 14.9833 shifts every deviation, and the error compounds once you square. Keep the full mean until the last step.
- Dividing when you should not. The sum of squares is not divided by anything. Divide it and you have made a variance, which is a different quantity and a different answer.
- Using n minus 1 by reflex. That correction belongs to the sample variance, not to SS. The sum of squares is the same number whether your data is a sample or a population.
- Averaging the group means in ANOVA. The grand mean is the mean of all N values. With unequal group sizes, averaging the group means gives a different and wrong answer.
- Forgetting the group size weight in SSB. Each squared distance has to be multiplied by that group’s n before you add it.
- Comparing R squared across two different scales. Fit a curve by taking logs and the sums of squares belong to ln y, not to y. Our exponential regression calculator reports both so the two do not get mixed up.
Two checks catch nearly all of these. The deviations must add to zero, and in regression and ANOVA the parts must add back to the total. If either fails, the mistake is upstream of wherever you noticed it.
Why use this sum of squares calculator?
What you get with this free sum of squares calculator:
- SST, SSR and SSE worked out from your own x and y pairs, which no other free sum of squares tool does.
- The ANOVA between and within split, with degrees of freedom, mean squares and the F ratio.
- Every deviation and every square listed in a table you can copy into your working.
- Both formulas run side by side, so you can see the definitional and the computational route agree.
- Variance and standard deviation returned alongside SS, since that is usually the next thing you need.
- The 1 squared plus 2 squared series with the n(n+1)(2n+1) over 6 formula, for any range you like.
- Commas, spaces, tabs or line breaks all accepted, so a column pasted from a spreadsheet works unchanged.
- Free to use
- No sign-up
- Full working shown
- Regression and ANOVA
- Copy the table
Frequently asked questions
How do I calculate the sum of squares?
Find the mean, subtract it from every value, square each of those differences, then add the squares. For 72, 85, 91, 68, 77, 84, 90 and 65 the mean is 79 and the sum of squares is 696. Paste your own numbers above and every step appears underneath.
What is the formula for the sum of squares?
SS = Σ(x − x̄)². The equivalent computational version is SS = Σx² − (Σx)² ÷ n, which is quicker by hand because it needs only two running totals and never asks you to write the mean down.
How do I calculate the sum of squares in Excel?
Use =DEVSQ(A1:A8) for the sum of squared deviations from the mean, or =SUMSQ(A1:A8) for the sum of the raw squares. Both work the same way in Google Sheets. Neither one gives you SST, SSR or SSE, which need the Regression tool under Data Analysis.
What is the sum of squares of 14?
If you mean 1 squared through to 14 squared, the answer is 1,015, from 14 times 15 times 29 divided by 6. If you mean 14 on its own, it is 196. Use the First n squares tab for the first reading and the Raw squares tab for the second.
What is the difference between the sum of squares and variance?
Variance is the sum of squares divided by the degrees of freedom. SS keeps growing as you add data points, so it cannot be compared between datasets of different sizes. Dividing turns it into an average, which can. Our variance calculator does that division for you.
Can the sum of squares be negative?
No. Every term is something squared, so nothing in the total can be below zero. It equals exactly zero only when all your values are identical. A negative result means an arithmetic error, most often a sign lost while subtracting the mean.
Is SSE the same as the residual sum of squares?
Yes. SSE, RSS and the error sum of squares all mean Σ(y − ŷ)², the squared residuals added together. Be careful with RSS though, because a few regression texts use it for the regression sum of squares instead, which is the opposite quantity. Check the formula rather than the letters.
Do I use n or n minus 1 with the sum of squares?
Neither. The sum of squares is not divided at all. The choice between n and n minus 1 only arrives at the next step, when you turn SS into a variance: n minus 1 for a sample, n for a whole population.
Explore our other calculators
 Average calculator
 Average percentage calculator
 Average time calculator
 Degrees of freedom calculator
 Exponential Regression Calculator
 Five Number Summary Calculator
 Histogram maker
 IQR calculator
 Linear regression calculator
 Mean, Median, Mode and Range Calculator
 Outlier Calculator
 Pie Chart Maker
 Probability Calculator
 Standard deviation calculator
 Variance calculator
 Weighted average calculator
Our latest blogs
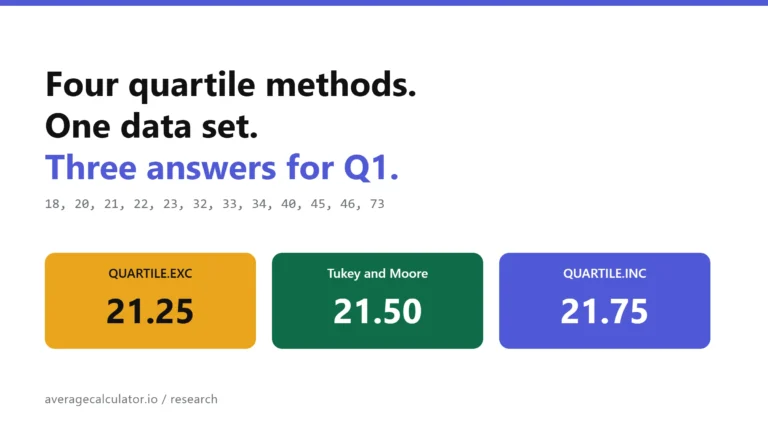
Four quartile methods, one data set, three answers for Q1
Standard deviation graph: how to read one and how to make one

Excel vs Google Sheets vs LibreOffice: how average functions handle blanks, zeros and text

How to calculate a weighted average in Excel, with examples

Mean vs median: which average should you use?
Who made this calculator
Spotted a mistake in this calculator? Tell us the numbers you used and what you expected, and we will check it.
Report an error