
Five number summary calculator
Paste your data and get the 5 number summary: the minimum, Q1, the median, Q3 and the maximum, with the interquartile range, the outlier fences and a box plot drawn from them. Pick the quartile definition your course uses, or compare all four at once.

 By Catherine Risinger · Reviewed by Ozlem Ozturk✓ Fact-checked
How to use the five number summary calculator
- 1Paste your numbers
Commas, spaces, tabs or one per line all work, so a column copied out of Excel or Google Sheets goes straight in. Switch to Value and frequency if your data is already tallied.
- 2Press Calculate
You get the minimum, Q1, the median, Q3 and the maximum, plus the interquartile range, the outlier fences and a box plot drawn from them.
- 3Pick the quartile method your course uses
There is more than one definition of a quartile and they disagree. The default matches a TI-84. Excel and R can give you different numbers from the same data.
- 4Compare all four
Switch the method to Compare and the calculator works out every definition at once, so you can see how much your answer depends on the one you picked.
How the five numbers were worked out
What a 5 number summary is
A 5 number summary is five numbers, in this order: the minimum, the first quartile, the median, the third quartile and the maximum. Between them they mark the quarters of your data. A quarter of the values sit below Q1, half sit below the median, three quarters sit below Q3.
minimum, Q1, median, Q3, maximum
The point of it is that five numbers describe a distribution better than one does. A mean of 62 tells you nothing about whether the values are bunched together or spread from 17 to 95. The five number summary tells you where the middle is, how wide the middle half is, and how far the tails reach.
It is written both ways. A 5 number summary and a five number summary are the same five numbers, and you will see each spelling in different textbooks. It is also what a box plot is drawn from, which is why the two always turn up together in the same chapter.
How to find the 5 number summary by hand
Take nine quiz scores: 17, 46, 54, 59, 65, 67, 75, 85 and 95. They are already in order, which is always the first step.
The minimum is 17 and the maximum is 95. With nine values the median is the fifth one, 65. That leaves the two quartiles, which are just medians of the halves: Q1 is the median of the values below the middle and Q3 is the median of the values above it.
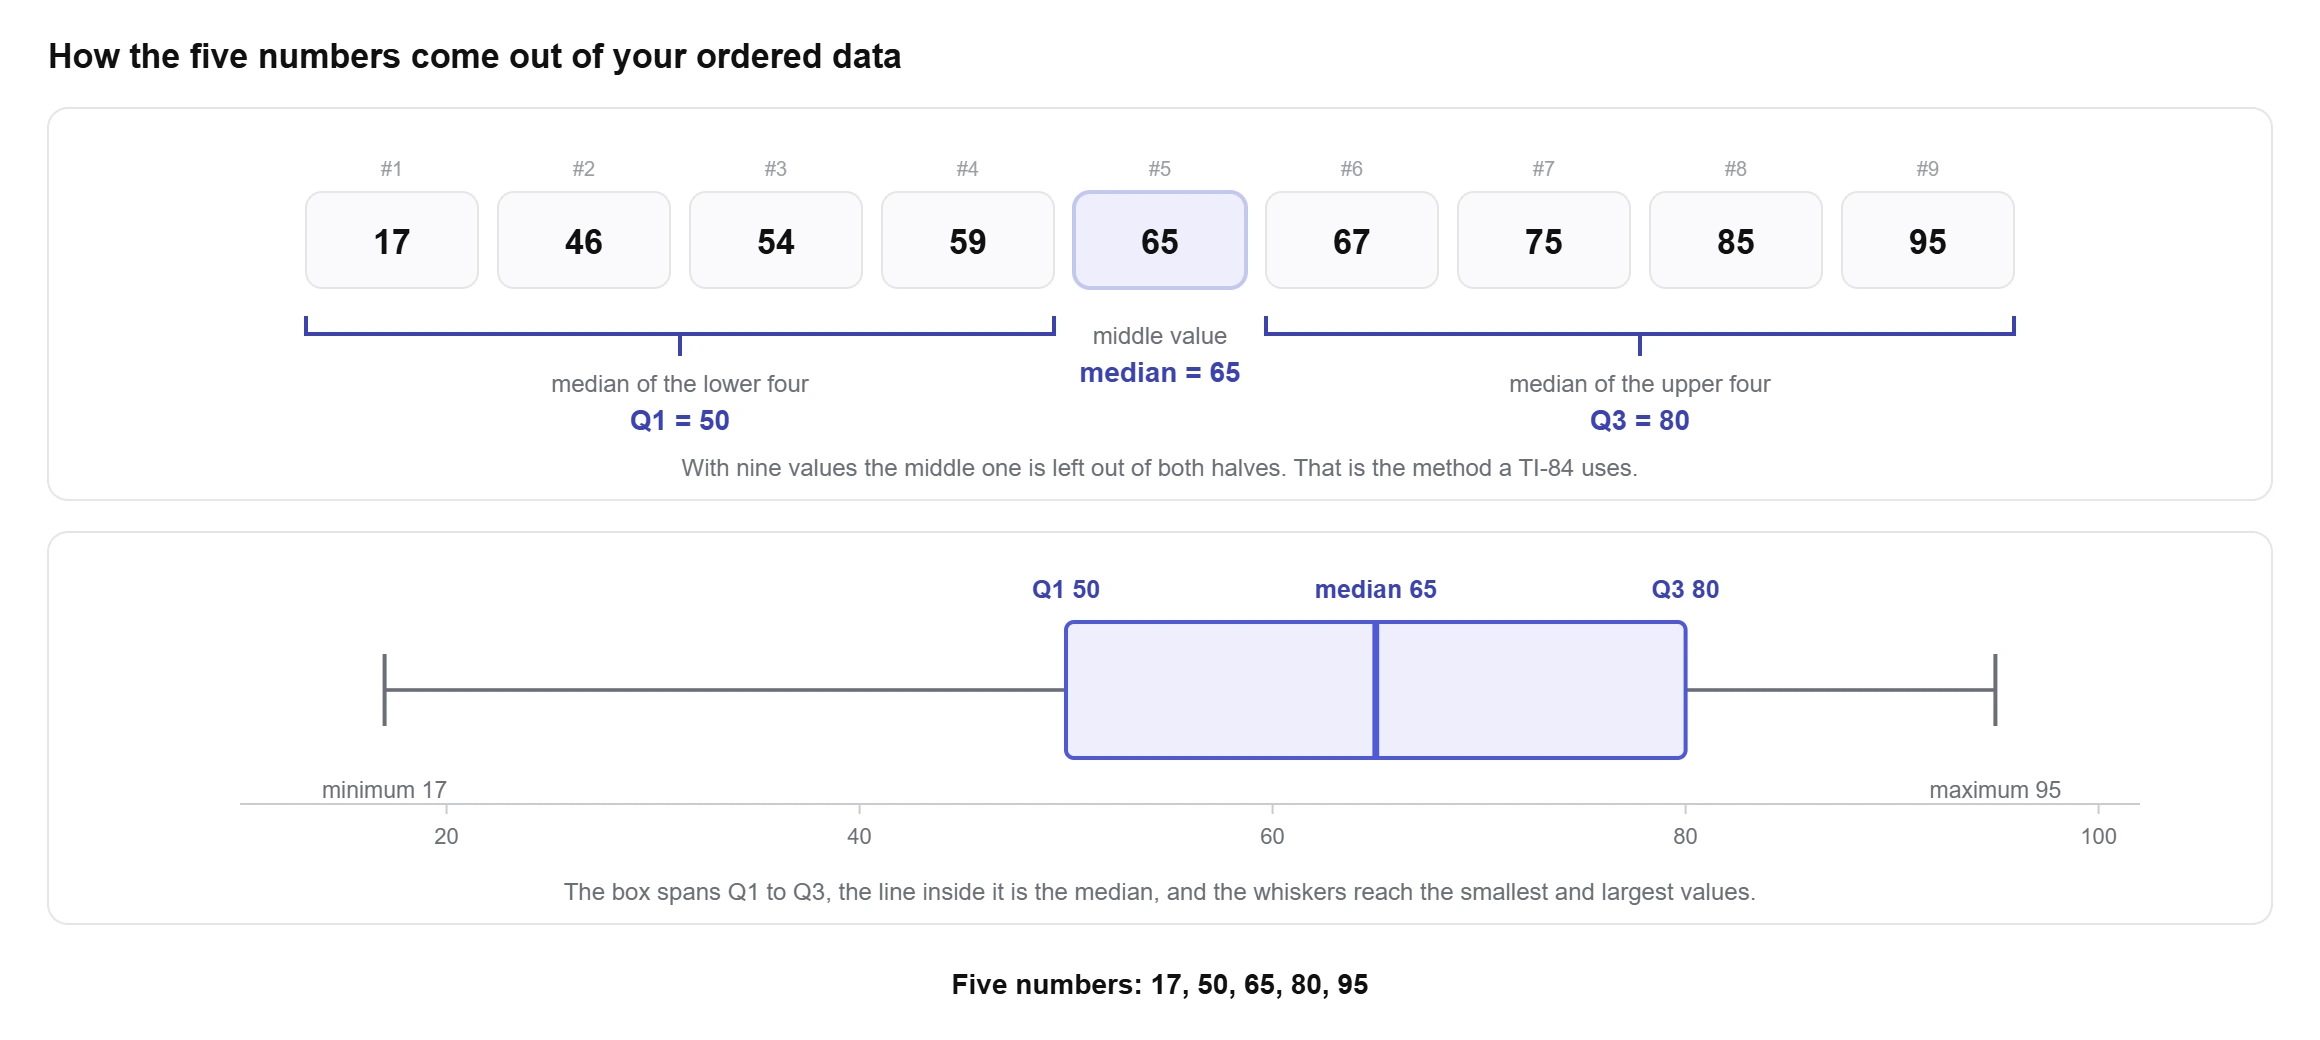
lower half: 17, 46, 54, 59 → Q1 = (46 + 54) ÷ 2 = 50
upper half: 67, 75, 85, 95 → Q3 = (75 + 85) ÷ 2 = 80
summary: 17, 50, 65, 80, 95
The interquartile range falls straight out of it: 80 − 50 = 30. That is the width of the middle half, and it is the number you want when you are asked how spread out the data is without letting one extreme value dominate the answer.
Why your Q1 does not match the back of the book
Here is the part most calculators skip. There is no single agreed definition of a quartile. Eric Langford catalogued the ones actually in use and found fifteen, and they do not all give the same answer (Langford, Quartiles in Elementary Statistics, Journal of Statistics Education 14(3), 2006). His paper opens with the exact complaint students bring to it: they check a MINITAB or Excel result on a TI-83 and get a third number, none of which matches the textbook.
Four definitions cover almost everything you will meet. Two of them split the data at the median and take the median of each half, differing only over whether the middle value belongs to both halves or to neither. The other two skip the splitting entirely and read the quartile off a position in the list, interpolating between neighbours when the position lands between two values.
- Median excluded. With an odd count the middle value goes into neither half. TI-83, TI-84 and TI-89 use this one, and so do Moore and McCabe, which is why it is the default in most US statistics courses. It is the default here too.
- Median included. The middle value goes into both halves. This gives Tukey’s hinges, which is what R’s
fivenum()returns. - Interpolation, inclusive. The quartile sits at position 1 + (n − 1) × 0.25. This is Excel’s QUARTILE.INC, Google Sheets QUARTILE, and the default in numpy and pandas. Langford numbers it method 12 and records it as the Excel method.
- Interpolation, exclusive. The position is (n + 1) × 0.25 instead. This is Excel’s QUARTILE.EXC and type 6 in R.
On those nine quiz scores the split is clean. The two methods that exclude the middle value give Q1 = 50 and Q3 = 80. The two that include it give Q1 = 54 and Q3 = 75. Same nine numbers, and an interquartile range of either 30 or 21 depending on nothing but the convention.
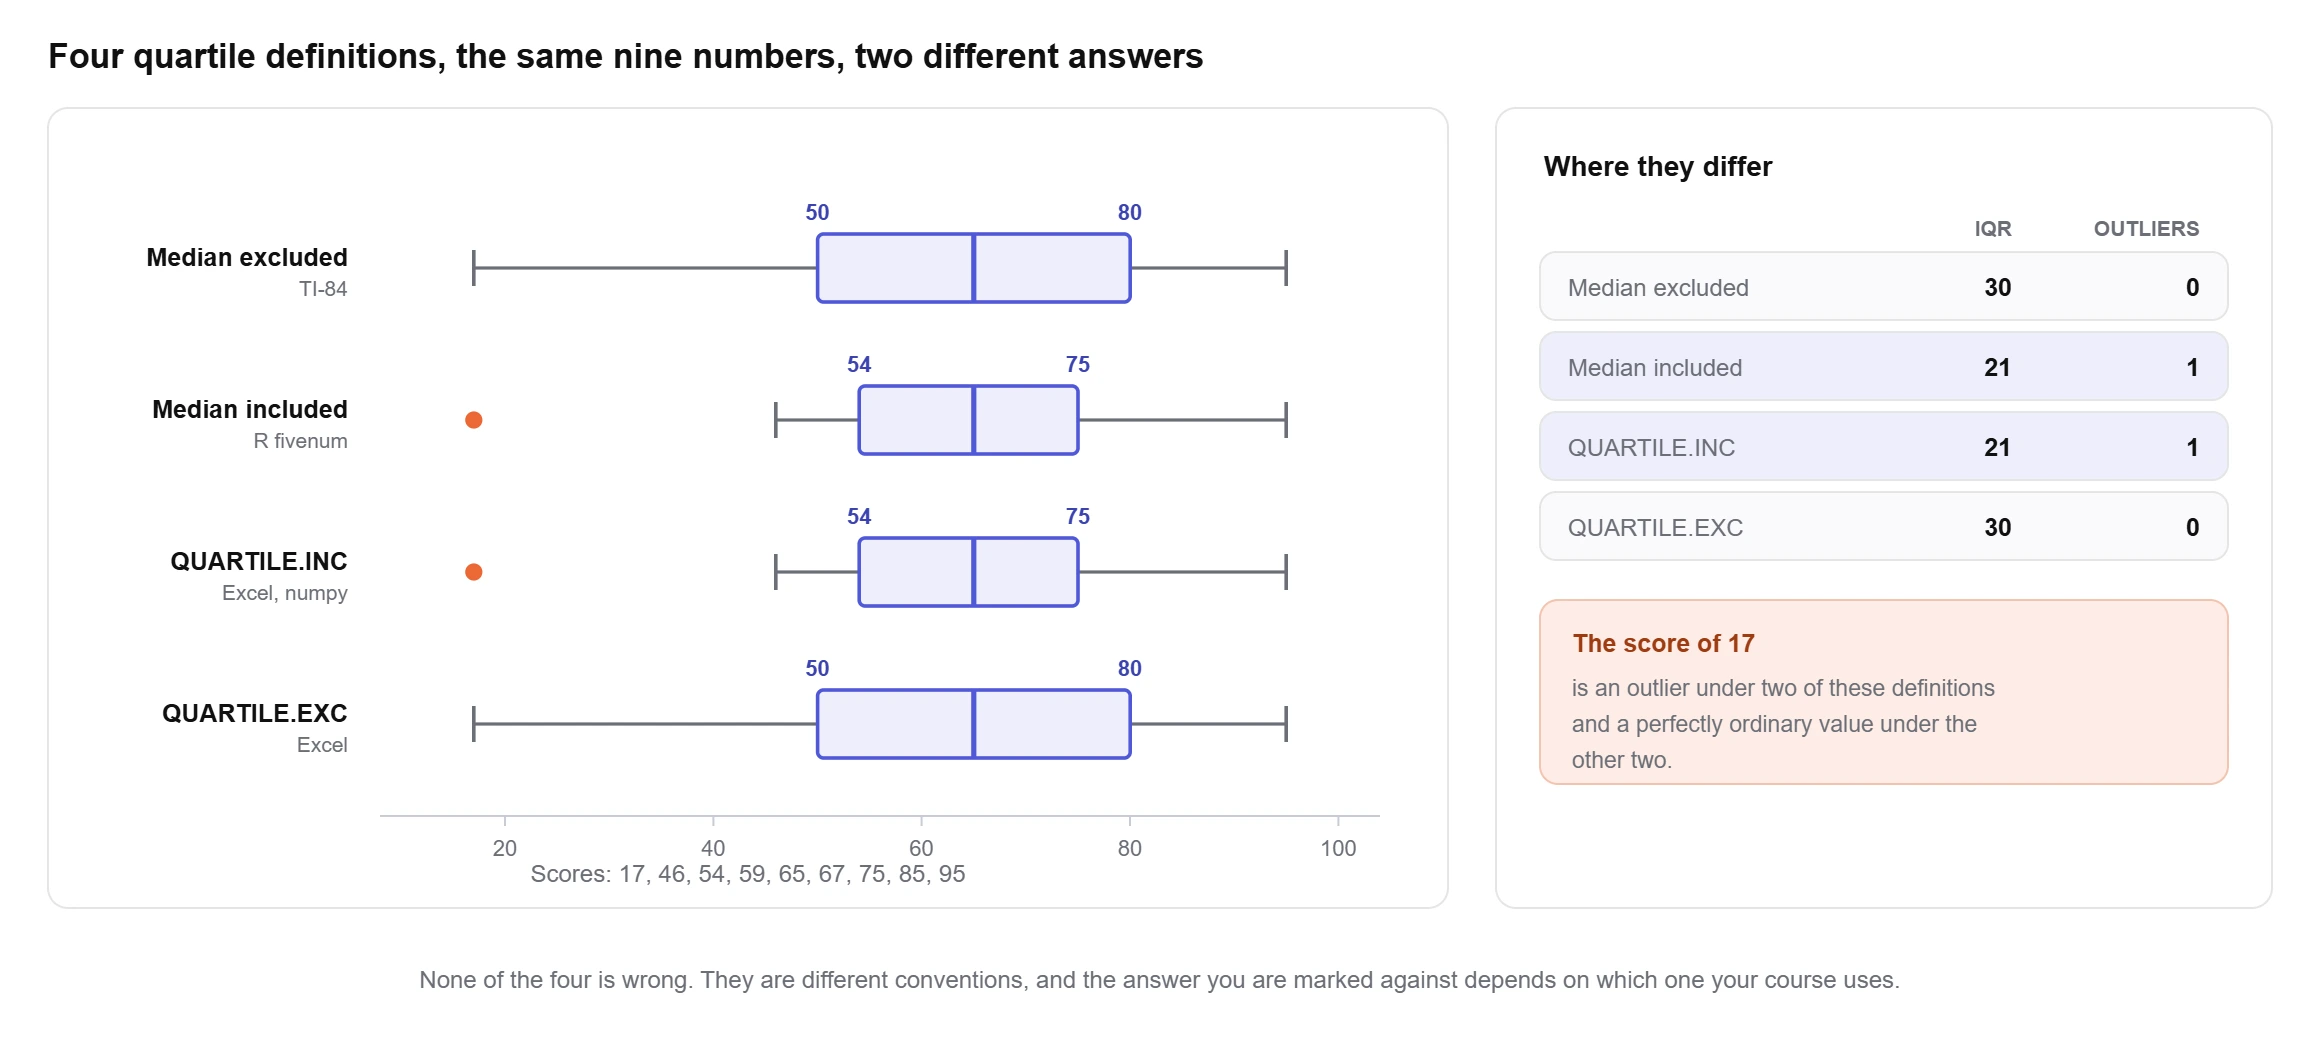
That gap is not cosmetic. With Q1 = 50 and Q3 = 80 the lower fence sits at 5, and every score is inside it. With Q1 = 54 and Q3 = 75 the lower fence rises to 22.5, and the score of 17 becomes an outlier. One dataset, and whether you report an outlier at all comes down to which definition you picked. Running all four methods over 23,760 data sets showed that an odd count always gives two different values for Q1 and an even count always gives three.
The methods converge as n grows and they agree exactly whenever the quartile positions land on real data points, so on a large tidy dataset you may never notice. On the small datasets that appear in homework, you will. Set the method to Compare above and the calculator works out all four, which is the quickest way to find out whether your answer and your marker’s answer were ever going to match.
Reading the box plot and the outlier fences
A box plot is the five number summary drawn to scale. The box runs from Q1 to Q3, so it holds the middle half of the data. The line inside it is the median. The whiskers reach out towards the extremes.
Outliers are decided by the fences, which Tukey set at one and a half interquartile ranges beyond each end of the box.
lower fence = Q1 − 1.5 × IQR
upper fence = Q3 + 1.5 × IQR
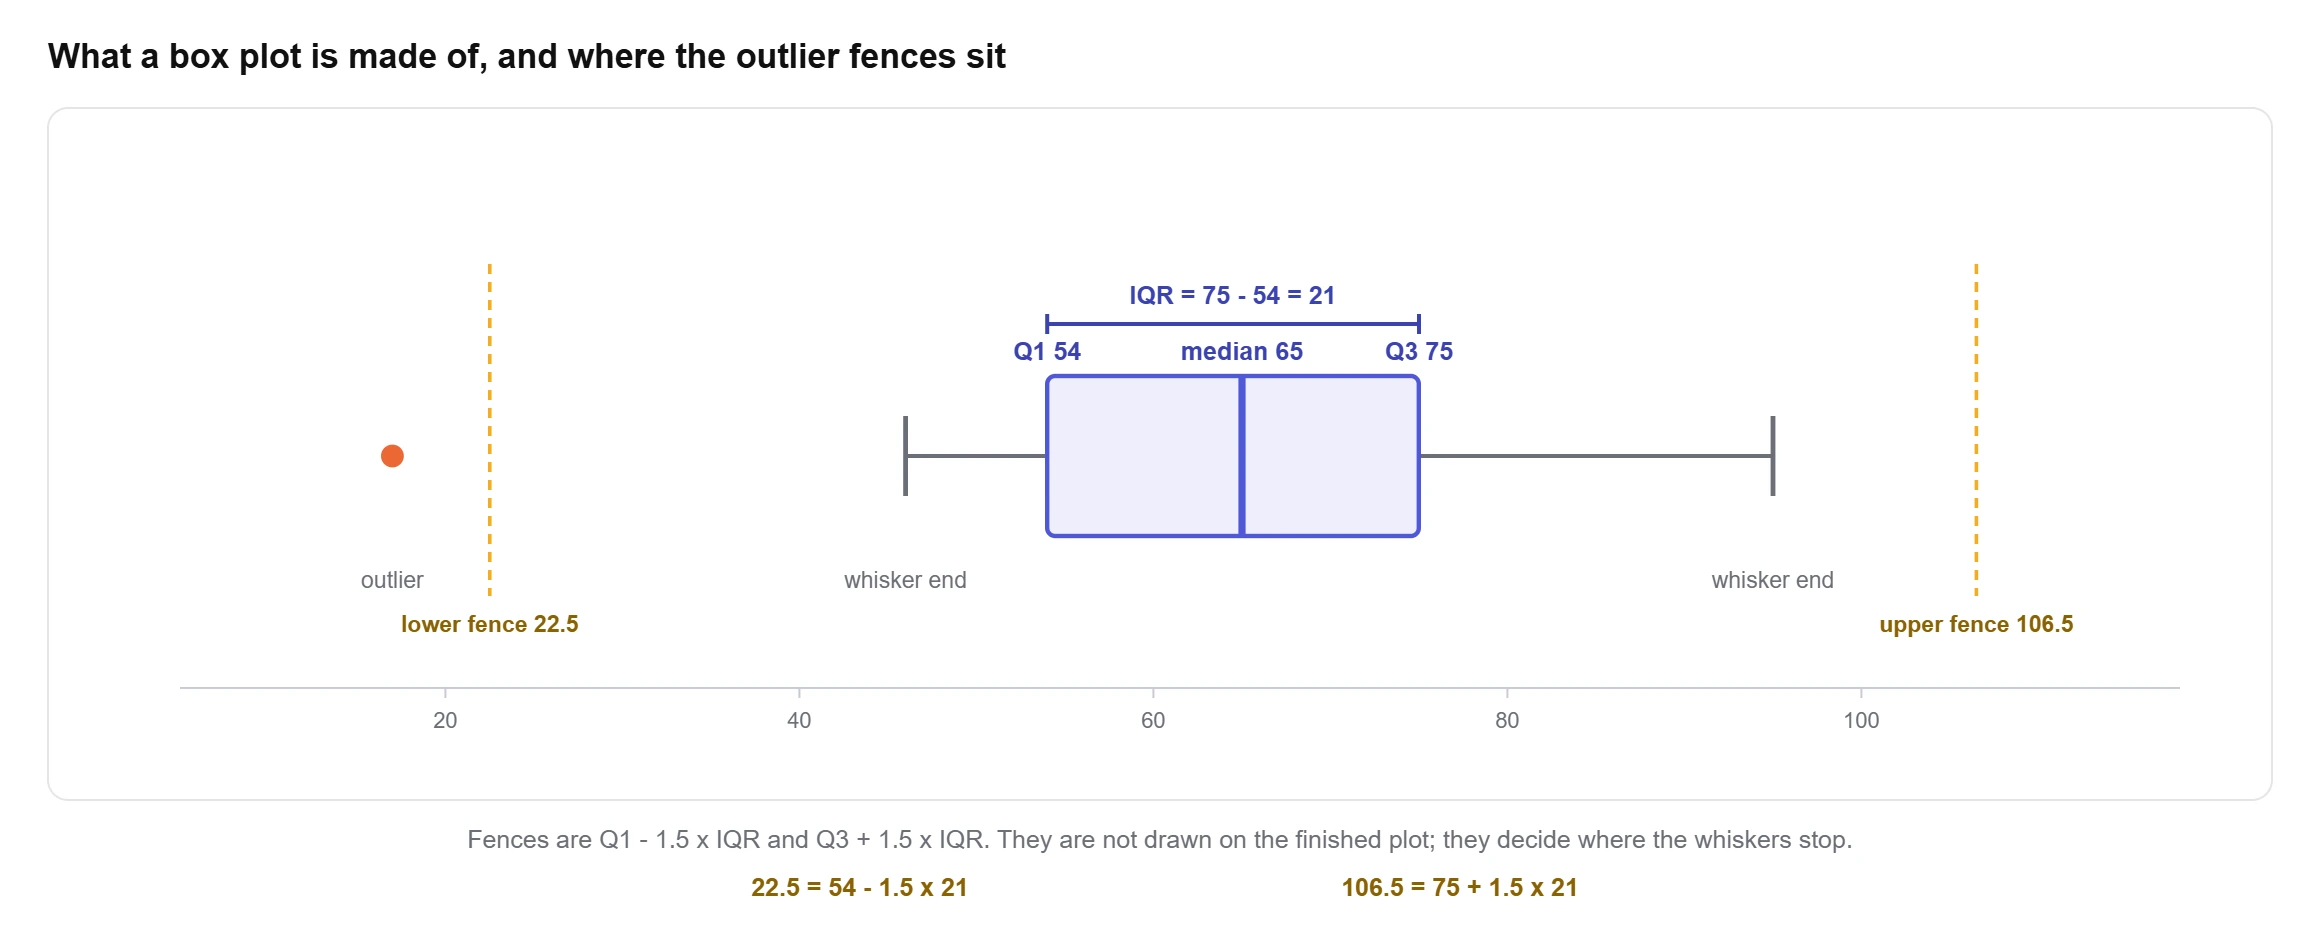
There are two whisker conventions and they trip people up constantly. The school version runs the whiskers all the way to the minimum and the maximum, so the plot shows the full range and nothing is marked as an outlier. The version every statistics package draws stops each whisker at the most extreme value still inside the fences and plots anything beyond as a separate dot. Both are correct and they look different on the same data, which is why the calculator lets you switch between them rather than picking one silently.
One thing a box plot cannot show you is whether the data has two peaks. Five numbers hide that completely, and two very different distributions can produce identical boxes. If the shape matters, put the same values through a histogram as well and compare the two.
Five numbers or the mean and standard deviation
Both describe a set of numbers. They fail in different places, and that is the whole basis for choosing.
The mean and standard deviation use every value, so a single extreme number drags both of them. On the nine quiz scores the mean is 62.56 and the sample standard deviation is 22.84. Take the 17 out and both move a long way. The median stays at 65 whatever you do to the lowest score, and Q1 and Q3 barely flinch. That resistance is the reason the five number summary is the standard choice for skewed data, incomes, response times and anything with a long tail.
The trade is that the five numbers throw information away. They cannot be fed into a t test or a confidence interval, and they say nothing about the values between the quartiles. For symmetric data with no outliers, the mean and standard deviation carry more and cost you nothing.
A quick check: compare the mean against the median. When they sit close together the distribution is roughly symmetric. When the mean is well above the median, something is pulling the top tail, and the five number summary is the more honest description.
Five number summary in Excel and Google Sheets
Excel gives you the whole summary in one function if you use the inclusive one. QUARTILE.INC takes a second argument from 0 to 4, and Microsoft documents those as the minimum, Q1, the median, Q3 and the maximum in order.
=QUARTILE.INC(A2:A10, 0) minimum
=QUARTILE.INC(A2:A10, 1) Q1
=QUARTILE.INC(A2:A10, 2) median
=QUARTILE.INC(A2:A10, 3) Q3
=QUARTILE.INC(A2:A10, 4) maximum
QUARTILE.EXC will not do the same job. It returns #NUM! for a second argument of 0 or 4, so it can give you the two quartiles but not the minimum or the maximum. Pair it with MIN and MAX if that is the definition you need.
The plain QUARTILE function, still there for compatibility, behaves as QUARTILE.INC. So a spreadsheet built before 2010 and a TI-84 will disagree on the same column, and neither is broken.
Google Sheets has QUARTILE, QUARTILE.INC and QUARTILE.EXC with the same arguments. Neither application will draw the box plot for you the way a statistics package does; Excel’s Box and Whisker chart type is the closest, and it uses its own quartile rules again.
Five number summary on a TI-84 or TI-83
- Press STAT, choose 1: Edit, and type your values into L1.
- Press STAT, arrow across to CALC, and select 1: 1-Var Stats. Press ENTER, then ENTER again on Calculate.
- Scroll down past the mean and the standard deviations. The last five lines are minX, Q1, Med, Q3 and maxX.
Those five lines are the five number summary, in order, and the calculator uses the median excluded definition to produce them. If your data is already tallied, put the values in L1 and the counts in L2, then set FreqList to L2 on the 1-Var Stats screen.
To see the box plot, press 2nd then Y= for STAT PLOT, turn Plot1 on, choose one of the two boxplot icons, and press ZOOM then 9: ZoomStat. The first icon is the modified plot that shows outliers separately; the second runs the whiskers to the minimum and maximum.
Five number summary in R and Python
R has two answers and they are not the same. fivenum(x) returns Tukey’s hinges, which is the median included method. summary(x) and quantile(x) use type 7 by default, the inclusive interpolation, the same one Excel uses. On small datasets those two R functions will print different quartiles for the same vector, which surprises people every time.
Python is more consistent. numpy.percentile(x, [0, 25, 50, 75, 100]) and pandas.Series.describe() both default to the inclusive interpolation. Numpy takes a method argument if you need one of the others, and the names there follow the same numbering the R documentation uses.
If you are checking a hand calculation against code, this is usually where the mismatch comes from rather than an arithmetic slip.
Where five number summary questions go wrong
Forgetting to sort first. Everything after that step is wrong if the list was not in order, and it is the single most common lost mark.
Treating the fences as data. The fences are calculated positions, not values from your dataset. A lower fence of 22.5 does not mean anything scored 22.5, and the whisker stops at the smallest actual value above it, not at the fence itself.
Deleting outliers because the rule flagged them. The 1.5 IQR rule is a convention for drawing attention, not a verdict. On perfectly normal data it flags roughly one value in a hundred by chance alone, so a flagged point in a large sample is expected rather than suspicious. Investigate it, then decide.
Reporting quartiles without saying which definition produced them. If a reader or a marker recomputes your Q1 and gets a different number, the argument that follows is avoidable. One sentence naming the method settles it.
Reading a wide box as a high average. The box width is spread, not level. A tight box sitting high and a wide box sitting low can share the same median.
Why use this five number summary calculator?
What you get with this free five number summary calculator:
- All four quartile definitions, named, so you can match a TI-84, Excel, R or your textbook instead of guessing why the numbers differ.
- A Compare view that works out every definition on your data at once and shows where they part company.
- The outlier fences printed as numbers, not just a list of flagged points.
- A box plot you can switch between the school convention and the version statistics packages draw.
- IQR, range, midhinge, mean and standard deviation alongside the five numbers.
- Six steps of working with your own numbers in them, including which values went into each half.
- Tallied data accepted as value and frequency pairs, so you do not have to type a value out fifteen times.
- Free to use
- No sign-up
- Four quartile methods
- Box plot and outliers
- Step by step working
Frequently asked questions
How do I calculate a 5 number summary?
Sort the values. The smallest is the minimum and the largest is the maximum. The median is the middle value, or the average of the two middle values when the count is even. Q1 is the median of the lower half and Q3 is the median of the upper half. Paste your data above and the calculator prints all six steps with your own numbers in them.
Can you find the 5 number summary on a calculator?
On a TI-84 or TI-83, enter the data in L1 and run STAT, CALC, 1: 1-Var Stats. Scroll to the bottom of the output and the last five lines are minX, Q1, Med, Q3 and maxX. A Casio fx-9750 or fx-CG50 reaches the same list through MENU, Statistics, CALC, 1-Var.
How do I calculate a 5 number summary in Google Sheets?
Use MIN, QUARTILE(range, 1), MEDIAN, QUARTILE(range, 3) and MAX, or get the whole thing from QUARTILE(range, 0) through QUARTILE(range, 4). Sheets also has QUARTILE.INC and QUARTILE.EXC, which use the two interpolation definitions. None of them matches a TI-84 on every dataset.
Why does my calculator give a different Q1 from my textbook?
Because there is no single definition of a quartile. Langford counted fifteen in use in 2006. Your TI-84 leaves the middle value out of both halves; Excel interpolates a position instead; R has two functions that disagree with each other. Set the method to Compare above to see all four answers for your data and work out which one your source is using.
What is the interquartile range and how is it related?
The IQR is Q3 − Q1, the width of the box in a box plot and the span of the middle half of the data. It comes free with the five number summary. Unlike the range it ignores both tails, so a single extreme value cannot inflate it, which is why it is the spread measure of choice for skewed data.
How do I find outliers from the five number summary?
Work out the IQR, then the fences at Q1 − 1.5 × IQR and Q3 + 1.5 × IQR. Anything below the lower fence or above the upper one is flagged. Some courses add a second pair at 3 times the IQR and call those extreme outliers. The calculator prints both fences and marks the flagged values in the table and on the plot. If you also want the z-score, the modified z-score and Grubbs' test on the same data, the outlier calculator runs all four side by side.
Does the five number summary replace the mean and standard deviation?
No, they answer different questions. The five numbers resist outliers and describe shape, so they suit skewed data. The mean and standard deviation use every value and feed into tests and confidence intervals, so they suit symmetric data. Reporting both is common and costs nothing.
How many values do I need?
The arithmetic works from two, but quartiles of a handful of numbers are unstable and the four definitions disagree most at small n. Four values is the point at which each quarter has something in it. For a summary you would put in a report, eight or more is a reasonable floor.
Explore our other calculators
 Average calculator
 Average percentage calculator
 Average time calculator
 Degrees of freedom calculator
 Exponential Regression Calculator
 Histogram maker
 IQR calculator
 Linear regression calculator
 Mean, Median, Mode and Range Calculator
 Outlier Calculator
 Pie Chart Maker
 Probability Calculator
 Standard deviation calculator
 Sum of Squares Calculator
 Variance calculator
 Weighted average calculator
Our latest blogs
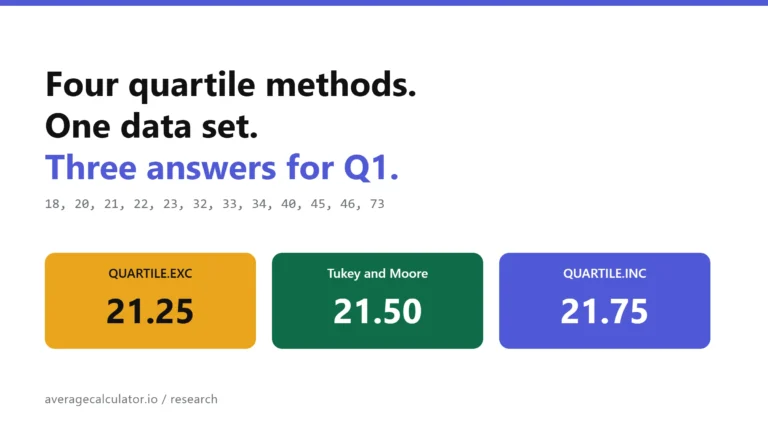
Four quartile methods, one data set, three answers for Q1
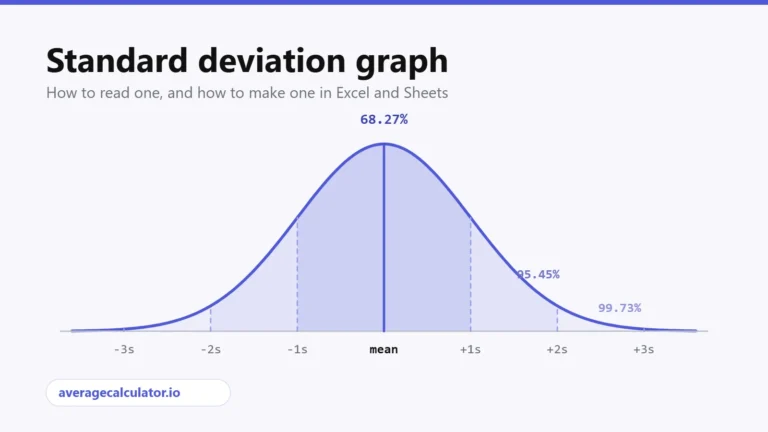
Standard deviation graph: how to read one and how to make one
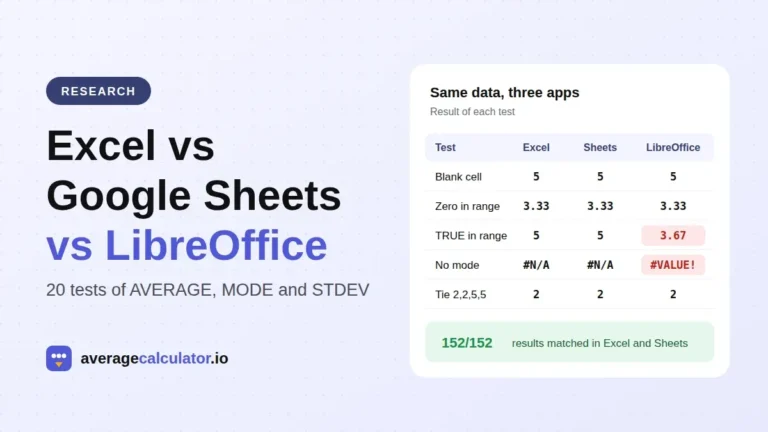
Excel vs Google Sheets vs LibreOffice: how average functions handle blanks, zeros and text
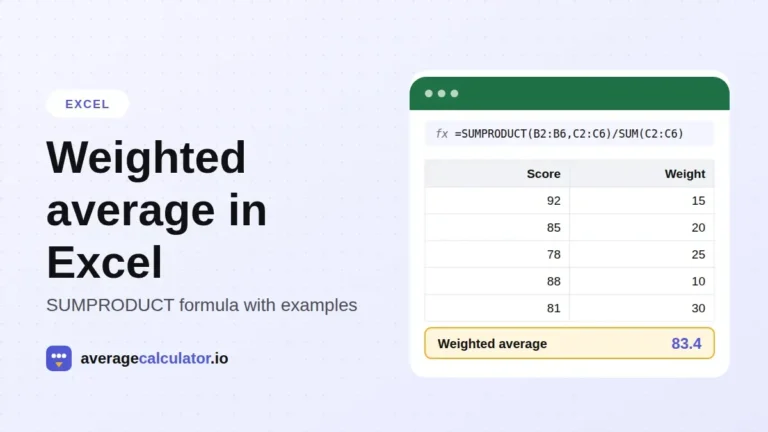
How to calculate a weighted average in Excel, with examples
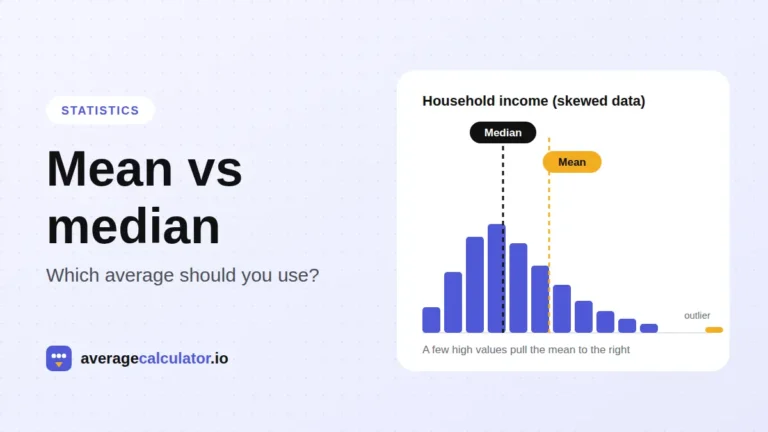
Mean vs median: which average should you use?
Who made this calculator
Spotted a mistake in this calculator? Tell us the numbers you used and what you expected, and we will check it.
Report an error