
Probability calculator
Work out the probability of one event, of two events together, or of something happening at least once over repeated tries. Type 0.25, 25% or 1/4 and read the answer as a decimal, a percentage, a fraction and as odds, with a Venn diagram drawn to scale from your own numbers.

 By Susan Simmons · Reviewed by Michael O'Brien✓ Fact-checked
Type in whatever you already know and leave the rest blank. The calculator works out everything your numbers determine, and tells you what they do not.
How to use the probability calculator
- 1Pick what you are working out
One event, two events together, a solver that fills in the values you do not have, or the chance of something happening over repeated tries.
- 2Type the numbers in any form
0.25, 25% and 1/4 all work, so you can paste a fraction straight out of a textbook question.
- 3Read every related probability at once
You get the AND, the OR, exactly one, neither and both conditional probabilities together, as a decimal, a percentage, a fraction and as odds.
- 4Check the picture
The Venn diagram is drawn to scale from your own numbers, so the overlap really is the size of P(A and B).
How this was worked out
What a probability actually measures
A probability is a number between 0 and 1 that says how much of the space of possible outcomes an event takes up. Zero means it cannot happen, 1 means it always happens, and everything interesting sits in between.
The reason the scale runs from 0 to 1 rather than 0 to 100 is that probabilities multiply. Two independent events with probabilities 0.5 and 0.5 give 0.25 when you multiply them, which is the right answer. Percentages do the same job but you have to keep dividing by 100, so the maths is written in decimals and converted at the end.
Everything else on this page is built on that one idea. Calculating probability for a compound event means finding how much of the sample space it covers, and the rules below are careful ways of adding and subtracting those areas without counting anything twice. The probability calculator above applies them all at once so you can see how the pieces fit together.
How to calculate probability: the basic formula
When every outcome is equally likely, the probability formula is a count divided by a count. This is the probability equation every course starts with, and most exam questions are a dressed up version of it.
P(E) = number of favourable outcomes ÷ number of possible outcomes
Draw one card from a standard 52 card deck and ask for the probability of a heart. Thirteen of the 52 cards are hearts, so:
P(heart) = 13 ÷ 52 = 0.25 = 1/4 = 25%
P(not a heart) = 1 − 0.25 = 0.75
Two conditions hide in that sentence and people skip both. Every outcome has to be equally likely, and you have to be able to count them. Neither holds for a question like the probability of rain tomorrow, which is why weather forecasts come from models rather than from counting. When the outcomes are not equally likely you fall back on counting how often each one actually happened, which is what the bar heights in a histogram already show you.
The complement rule follows immediately. The event either happens or it does not, so the two probabilities add to 1. It sounds trivial and it is the single most useful shortcut in the subject, because many questions that look hard head on are easy from the other side.
The probability formula for two events
Once there are two events, every question you can ask about them comes from three numbers: P(A), P(B) and the probability that both happen, P(A and B). Fix those three and the rest is arithmetic. Finding probability for a pair of events is really just deciding what the overlap is, then applying the formulas below.
P(A or B) = P(A) + P(B) − P(A and B)
P(exactly one of them) = P(A or B) − P(A and B)
P(neither) = 1 − P(A or B)
The subtraction in the first line is the whole point. Adding P(A) and P(B) counts the overlap once in each total, so it has to come off once to leave it counted exactly once. On a Venn diagram that is obvious. In an exam at eleven at night it is the mistake everyone makes.
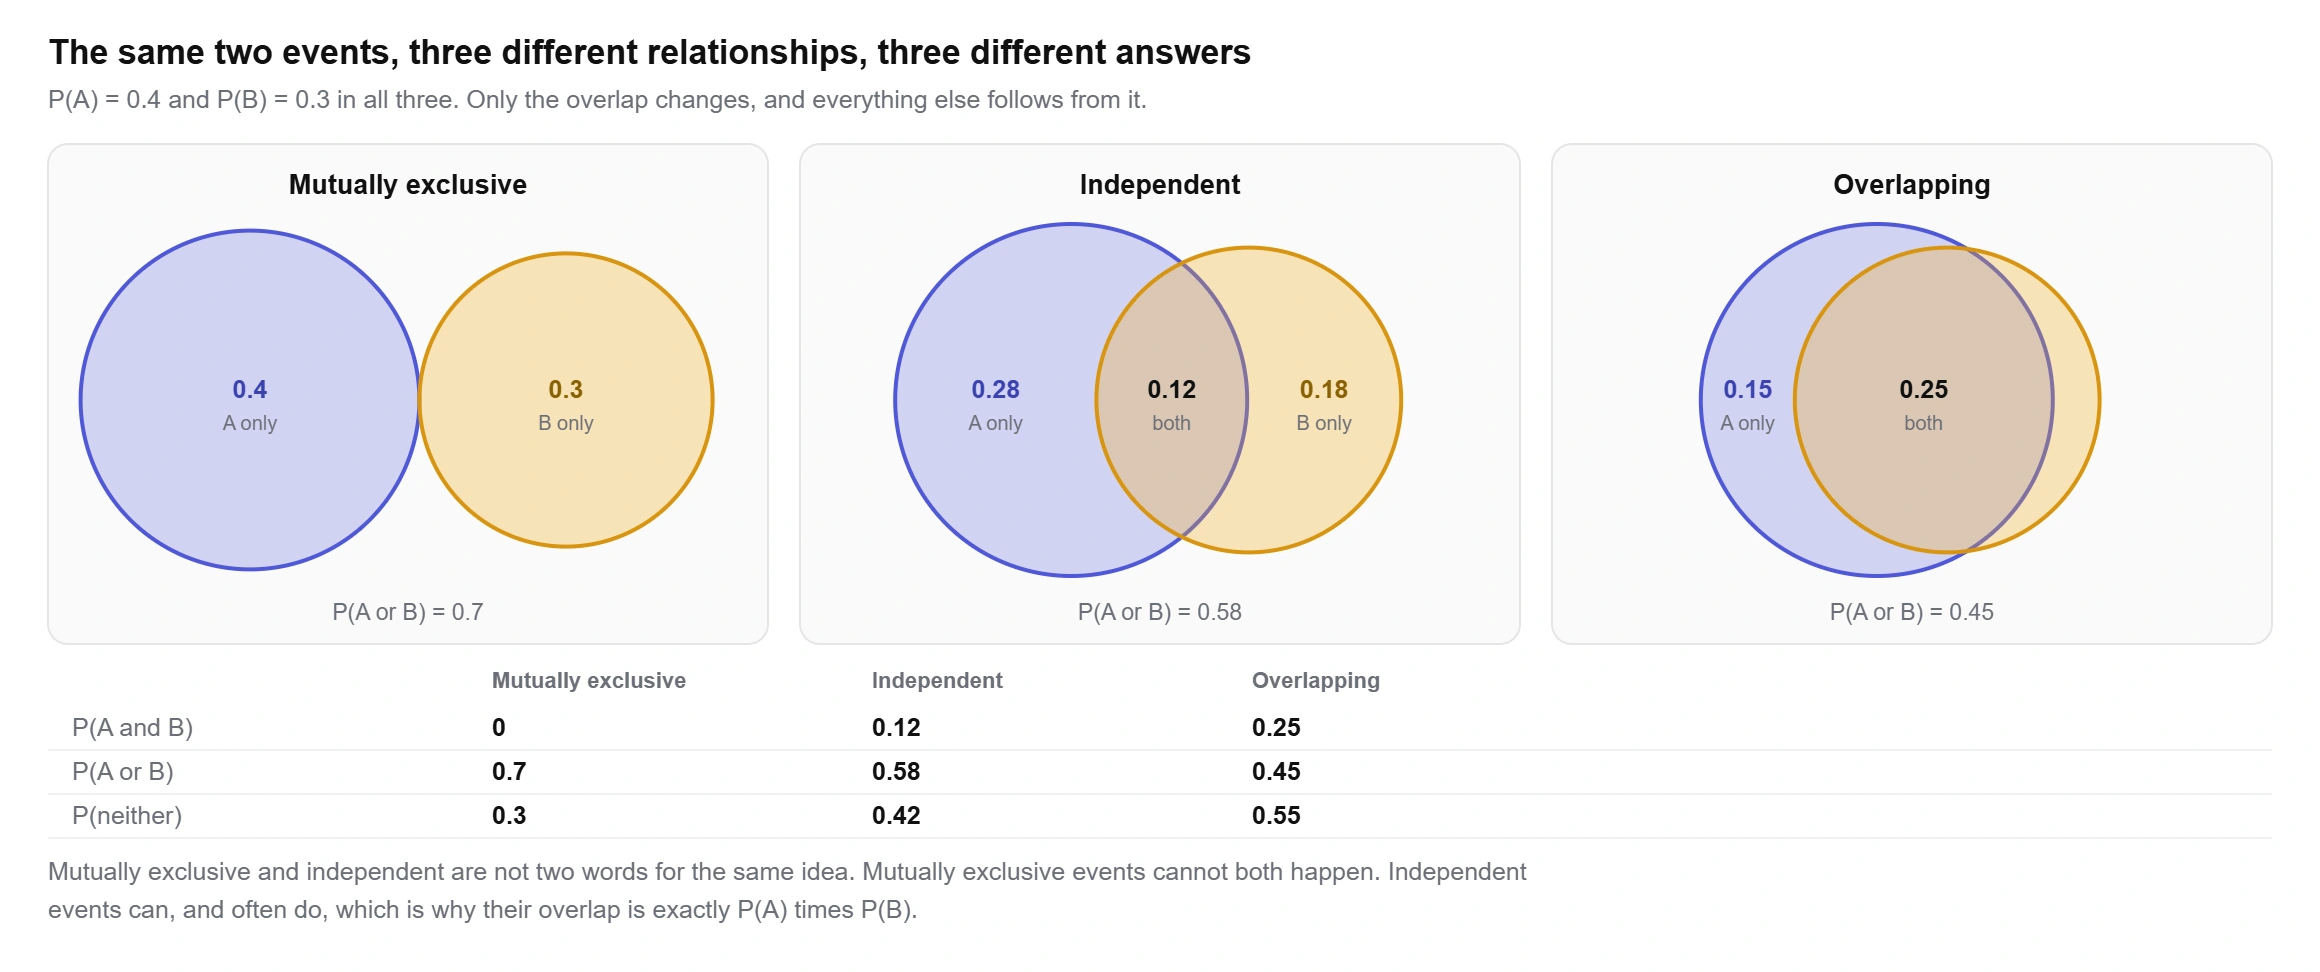
Notice how much rides on that middle number. With P(A) = 0.4 and P(B) = 0.3, the chance of at least one of them lands anywhere between 0.4 and 0.7 depending on how much the two events overlap. A question that gives you only P(A) and P(B) and asks for P(A or B) has not given you enough, unless it also tells you the events are independent or mutually exclusive.
There is a hard limit on the overlap too. P(A and B) can never exceed the smaller of the two probabilities, and when P(A) + P(B) is more than 1 the events are forced to overlap by at least the excess. Enter numbers outside that window and the calculator above says so instead of printing an answer that cannot exist.
Independent, mutually exclusive, dependent
These three words describe different things and get used as if they were interchangeable.
Independent means one event happening tells you nothing about the other. Two coin flips, two dice, two cards drawn with the first one put back. The overlap is the product:
P(A and B) = P(A) × P(B) = 0.4 × 0.3 = 0.12
Mutually exclusive means they cannot both happen. Rolling a 3 and rolling a 5 on one die. The overlap is zero, so the addition rule loses its last term and becomes plain addition.
Dependent means one changes the other, which covers everything else. Drawing two cards without replacement is the standard example: once the first heart is gone there are 12 hearts left in 51 cards.
Here is the part worth remembering. Mutually exclusive events are almost never independent. If A and B cannot both happen, then learning that A happened tells you B definitely did not, which is about as far from telling you nothing as it gets. The only exception is the degenerate case where one of them has probability zero. So when a question says the events are mutually exclusive, it is not also telling you they are independent, and multiplying the probabilities would be wrong.
The calculator checks this against your own numbers. Give it P(A), P(B) and P(A and B) and it compares the overlap with P(A) × P(B) and tells you which of the three you are actually looking at.
Conditional probability, P(A given B)
A conditional probability asks what the chance of A is once you already know B has happened. Knowing B shrinks the world to B, so the calculation is the part of B that is also A, divided by all of B.
P(A | B) = P(A and B) ÷ P(B)
Take P(A) = 0.4, P(B) = 0.3 and an overlap of 0.25. Then P(A | B) = 0.25 ÷ 0.3 = 0.8333. Knowing that B happened lifts the chance of A from 0.4 to 0.83, which tells you at a glance that these two events are far from independent.
That comparison is the cleanest test there is. If P(A | B) equals P(A), the events are independent. If it is higher, they go together. If it is lower, one pushes the other away. The two conditional probabilities are rarely equal to each other either, so P(A | B) and P(B | A) are different questions with different answers. Mixing them up has a name, the base rate fallacy, and it is behind a lot of bad reasoning about medical tests.
Rearranging the same formula gives the multiplication rule, which is how you handle draws without replacement:
P(A and B) = P(B) × P(A | B)
two hearts in a row: 13/52 × 12/51 = 0.0588
Three events, four events, or a whole chain
For independent events the AND rule extends by multiplying, however many there are.
P(A and B and C) = 0.4 × 0.3 × 0.5 = 0.06
The OR rule does not extend so kindly. With three events the inclusion and exclusion formula needs seven terms, and with four it needs fifteen. Almost nobody does it that way. Go through the complement instead, because “at least one happens” is the opposite of “none of them happens”, and none of them happening is a straight multiplication:
P(at least one) = 1 − P(none)
P(at least one) = 1 − (0.6 × 0.7 × 0.5) = 1 − 0.21 = 0.79
That single line answers most three event and four event questions, and it is the same move the repeated trials mode uses below. Work out the boring case, then subtract.
The chance of it happening at least once
Roll a die ten times. What is the chance of at least one six? Adding up one six, two sixes, three sixes and so on is a long afternoon. The complement takes a line.
P(no six on one roll) = 5/6
P(no six in ten rolls) = (5/6)10 = 0.1615
P(at least one six) = 1 − 0.1615 = 0.8385, or 83.85%
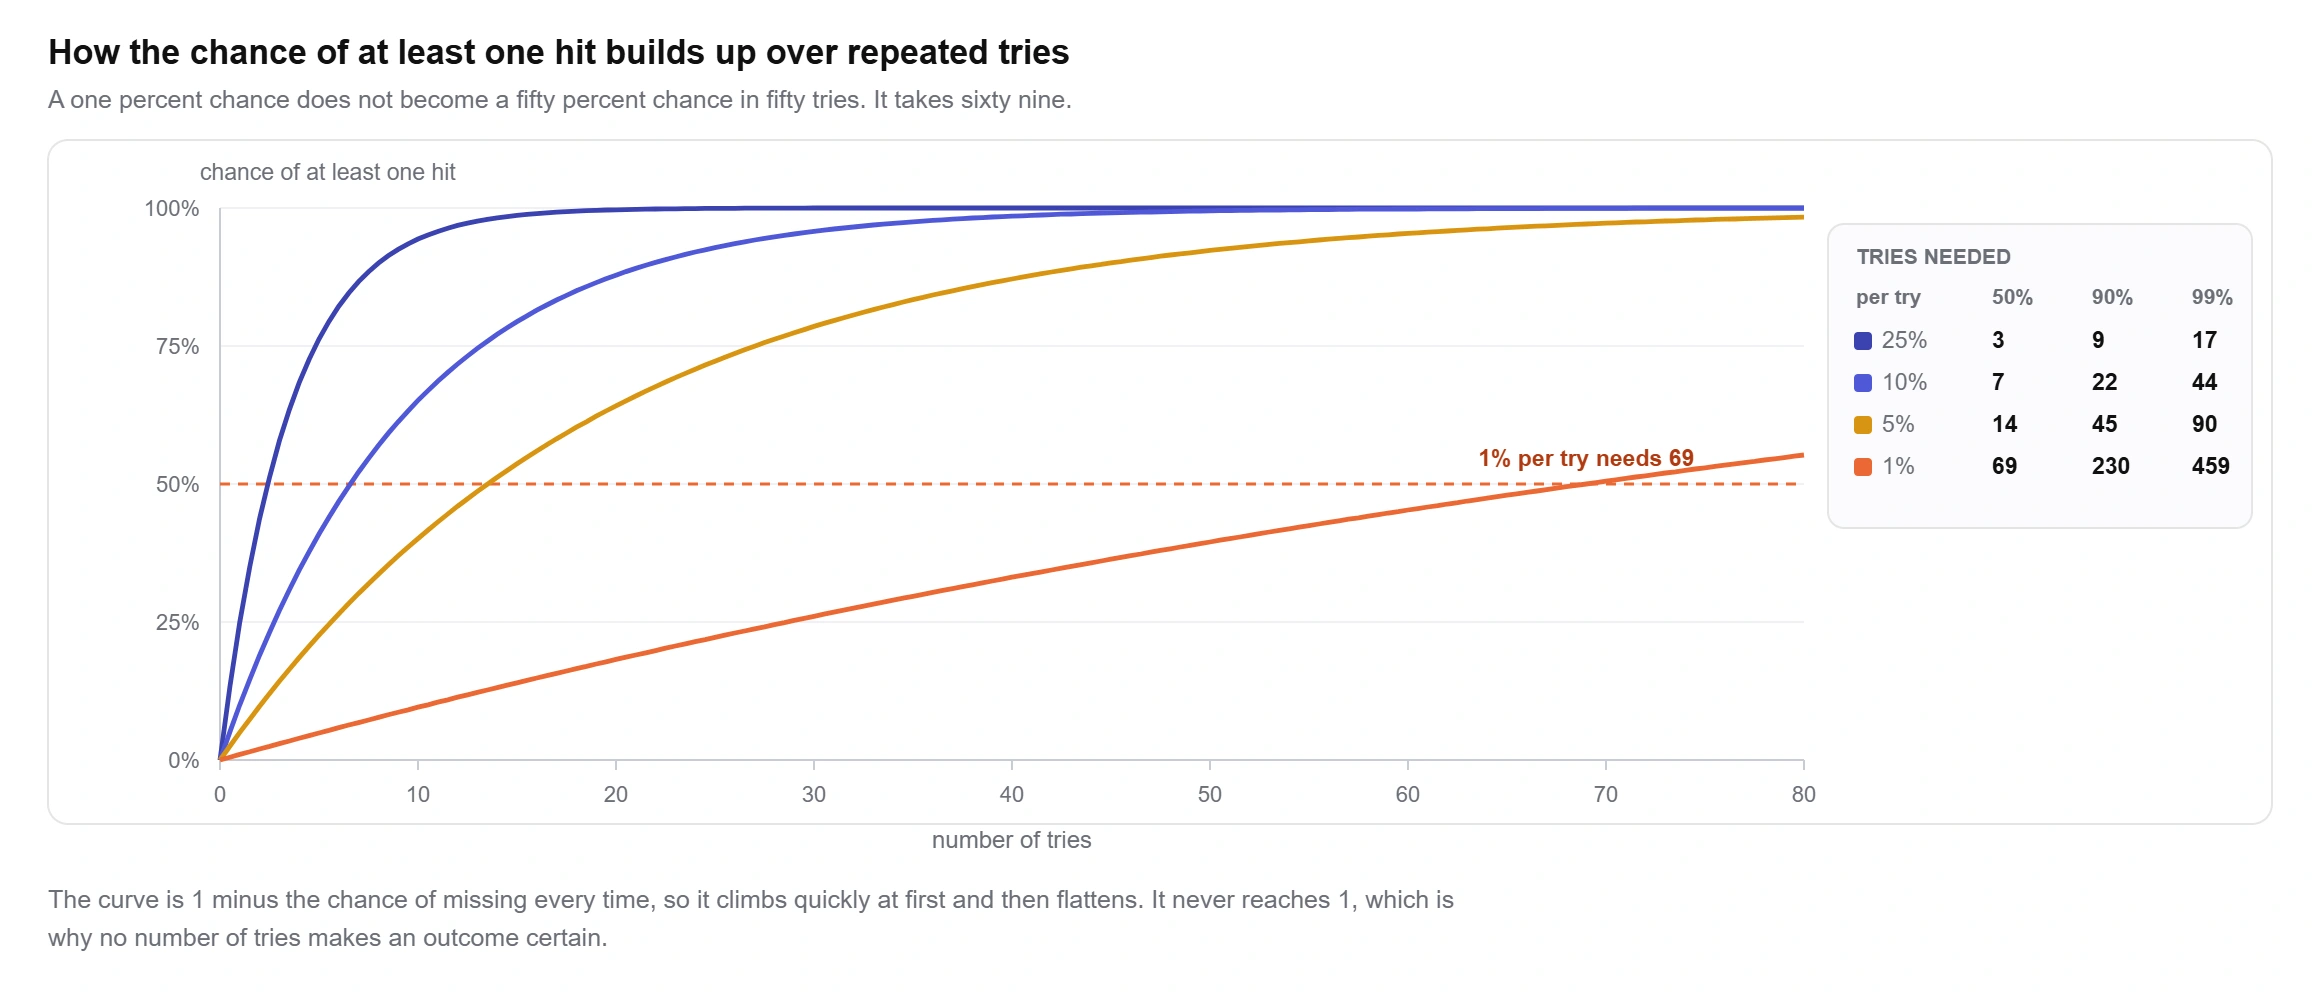
The shape of that curve is where intuition breaks. A one percent chance per try does not become a fifty percent chance in fifty tries, it becomes 39.5%. You need 69 tries for even money and 230 for a 90% chance. Turn the formula around and you can read the number of tries straight off:
n = log(1 − target) ÷ log(1 − p)
for a 90% chance at p = 0.01: n = log(0.1) ÷ log(0.99) = 230
Two things the curve never does. It never reaches 1, so no number of tries makes an outcome certain. And a run of misses does not make the next try more likely, because the tries are independent. That belief has a name, the gambler’s fallacy, and the arithmetic on this page is the reason it is wrong.
For the chance of exactly k hits rather than at least one, the binomial formula counts the orders the hits could come in:
P(exactly k) = C(n, k) × pk × (1 − p)n − k
exactly two sixes in ten rolls: 45 × (1/6)2 × (5/6)8 = 0.2907
Probability, percentages and odds
Percentages are the easy one. Multiply by 100 and add the sign, so 0.25 is 25%, which is all a probability percentage calculator ever does. Odds are where it goes wrong, because odds compare the successes with the failures instead of with the total.
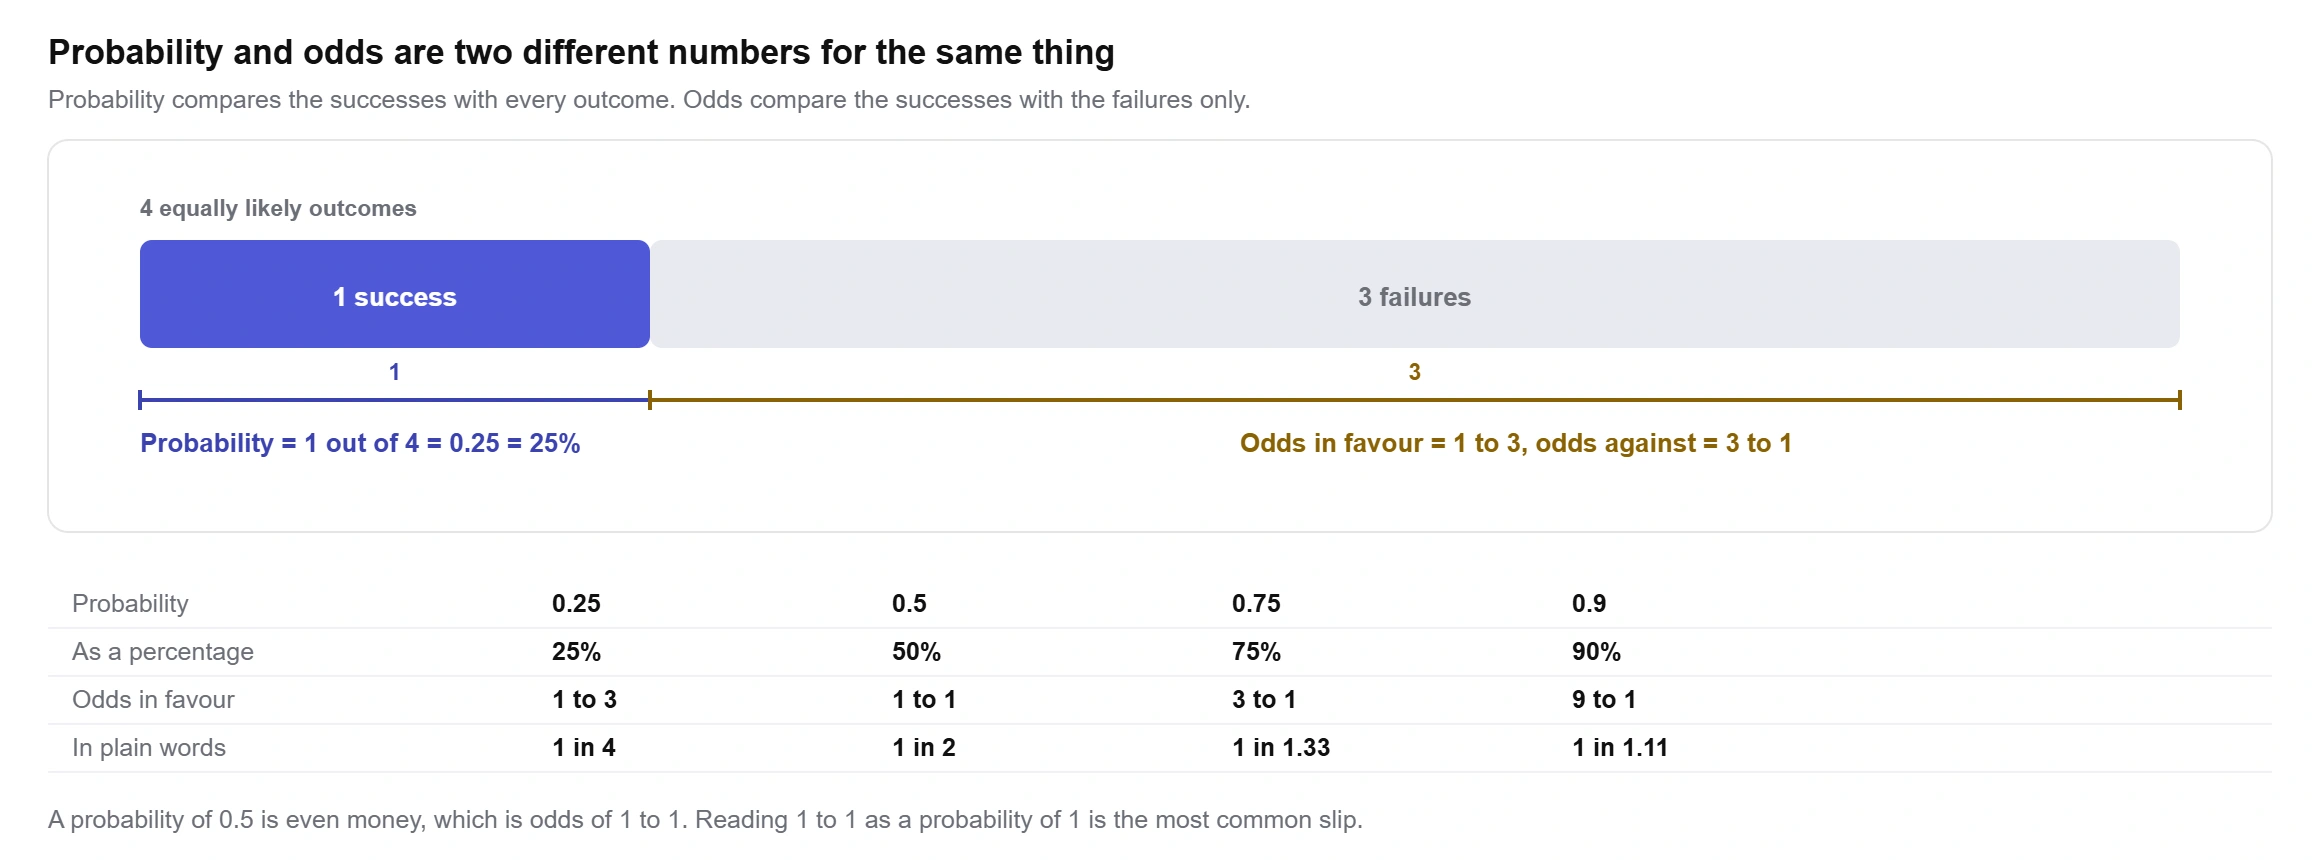
odds in favour = P ÷ (1 − P)
probability = odds ÷ (odds + 1)
0.25 becomes 0.25 ÷ 0.75 = 1/3, written 1 to 3
Even money, odds of 1 to 1, is a probability of 0.5 rather than 1. Anything written as “1 in 4” is a probability, not odds, even though it looks like one. The calculator prints the decimal, the percentage, the fraction and both sets of odds together so there is nothing to convert by hand.
Probability in Excel, Google Sheets and on a TI-84
There is no PROBABILITY function in either spreadsheet, because the basic calculation is a division. If you want to know how to find probability in Excel, you type the division yourself. The named functions only start once you reach the binomial.
single event: =favourable/total
at least one in n tries: =1-(1-p)^n
exactly k hits: =BINOM.DIST(k, n, p, FALSE)
k hits or fewer: =BINOM.DIST(k, n, p, TRUE)
how many ways: =COMBIN(n, k)
tries for a 90% chance: =CEILING(LOG(0.1)/LOG(1-p), 1)
Google Sheets takes every one of those unchanged. The older Excel name BINOMDIST still works but has been superseded, so use BINOM.DIST in anything you are handing to someone else.
On a TI-84, the probability calculator functions binompdf and binomcdf live under 2nd VARS. binompdf(10, 1/6, 2) gives 0.2907 for exactly two hits, and binomcdf(10, 1/6, 2) gives the running total for two or fewer. For the plain AND and OR rules there is no shortcut and no need for one, since they are arithmetic you can do on any calculator.
In Python, scipy.stats.binom.pmf(k, n, p) matches binompdf, and 1 - (1 - p) ** n is the at-least-once case. R uses dbinom(k, n, p) and pbinom.
Where probability questions go wrong
Adding when the events overlap. P(A or B) is only P(A) + P(B) when the two cannot happen together. Any other time you subtract the overlap, and forgetting to can push the answer above 1, which is the tell.
Multiplying when the events are dependent. P(A) × P(B) is the independent case only. Drawing two cards without replacement changes the second probability, and using 13/52 twice instead of 13/52 and 12/51 gives 0.0625 rather than the correct 0.0588.
Treating mutually exclusive as independent. Covered above and worth repeating, because the two phrases sound similar and mean close to opposite things.
Reading odds as a probability. Odds of 3 to 1 in favour are a probability of 0.75, not 3 and not 0.3. If a number you have called a probability comes out above 1, you have almost certainly written down odds.
Expecting the average to be the likely outcome. Ten rolls of a die give an average of 1.67 sixes, but the chance of at least one is 83.85% and the chance of exactly two is only 29%. An expected value of 1.67 does not mean you will see one or two.
Assuming a long run of misses is due. Independent tries have no memory. After nine tails the tenth flip is still 0.5, and the calculator will keep saying so however many tries you add.
Reading a small probability as impossible. A significance test can hand you a p value of 0.000007, which is what the outlier calculator returns on a clear outlier. That is not a claim the value cannot occur, only that it is very rare if the rest of the data is clean.
Why use this probability calculator?
What you get with this free probability calculator:
- Every related probability at once: AND, OR, exactly one, neither, both complements and both conditional probabilities, rather than the single value you asked for.
- A Venn diagram drawn to scale, where the circle areas and the overlap really are the size of your probabilities.
- Every answer as a decimal, a fraction, a percentage and as odds, so nothing needs converting afterwards.
- An independence check that reads your own numbers and tells you whether the events are independent, mutually exclusive or neither.
- Input checking. Enter an overlap that is bigger than one of the events and it says the numbers cannot all be true instead of printing something impossible.
- A solver that takes whatever you know, fills in everything that follows, and says plainly which values your numbers do not determine.
- A repeated trials mode with the curve of at least one hit against the number of tries, and the tries needed for a 50, 90 or 99 percent chance.
- Full working for every mode, written out with your own numbers in it.
- Free to use
- No sign-up
- Scaled Venn diagram
- Fractions and odds
- Step by step working
Frequently asked questions
What is the formula for probability?
For a single event with equally likely outcomes it is the number of favourable outcomes divided by the number of possible outcomes. For two events the three you need are P(A and B), P(A or B) = P(A) + P(B) − P(A and B), and P(neither) = 1 − P(A or B). Everything else on this page is built from those.
How do I calculate the probability of A and B?
If the events are independent, multiply: P(A) × P(B). If one affects the other, use P(B) × P(A given B). If they are mutually exclusive the answer is zero, because they cannot both happen. Picking the wrong one of those three is the most common error in the topic, so the calculator asks you which case you are in rather than assuming.
How do I calculate conditional probability?
Divide the probability that both happen by the probability of the event you are told has already happened: P(A | B) = P(A and B) ÷ P(B). Knowing B shrinks the sample space down to B, which is why B is the denominator. If the answer equals P(A), the two events are independent.
Can I enter probabilities as percentages or fractions?
Yes. Every input accepts 0.25, 25% and 1/4 and treats them as the same number, so a fraction copied out of a textbook question goes straight in. Results come back as a decimal, a fraction, a percentage and as odds at the same time.
What is the probability of at least one six in ten rolls?
83.85%. Work out the chance of no six on one roll, which is 5/6, raise it to the power of ten to get 0.1615 for missing every time, then subtract from 1. The repeated trials mode above does this for any probability and any number of tries, and also tells you how many tries you would need for a 90% chance.
What is the difference between mutually exclusive and independent?
Mutually exclusive means the two events cannot both happen, so P(A and B) is zero. Independent means one happening tells you nothing about the other, so P(A and B) is P(A) × P(B). Events that are mutually exclusive are not independent, because knowing that one happened tells you the other definitely did not.
How do I convert probability to odds?
Divide the probability by 1 minus the probability. A probability of 0.25 gives 0.25 ÷ 0.75 = 1/3, written as odds of 1 to 3 in favour or 3 to 1 against. Going the other way, odds of 3 to 1 in favour are a probability of 3 ÷ 4 = 0.75.
Can this calculator handle three or four events?
For independent events, yes, by multiplying: P(A and B and C) is the product of the three. For “at least one of them”, use the complement, 1 minus the product of the three probabilities of not happening. The two events mode covers the full set of relationships, which is where the harder questions live.
Why does the calculator say my numbers are impossible?
Because P(A and B) has to sit between max(0, P(A) + P(B) − 1) and min(P(A), P(B)). Both events have to happen for the overlap, so it cannot be bigger than either one, and when P(A) + P(B) is more than 1 they are forced to overlap. Most calculators print a number anyway; this one tells you which rule your figures break.
Why can the solver not work out every value?
Two events have three degrees of freedom, usually P(A), P(B) and P(A and B). Two values are often one short. Enter P(A or B) and P(A and B), for example, and you get the union, the intersection, exactly one and neither, but P(A) and P(B) separately stay open. The solver says which extra value would close the gap.
Explore our other calculators
 Average calculator
 Average percentage calculator
 Average time calculator
 Degrees of freedom calculator
 Exponential Regression Calculator
 Five Number Summary Calculator
 Histogram maker
 IQR calculator
 Linear regression calculator
 Mean, Median, Mode and Range Calculator
 Outlier Calculator
 Pie Chart Maker
 Standard deviation calculator
 Sum of Squares Calculator
 Variance calculator
 Weighted average calculator
Our latest blogs
Four quartile methods, one data set, three answers for Q1
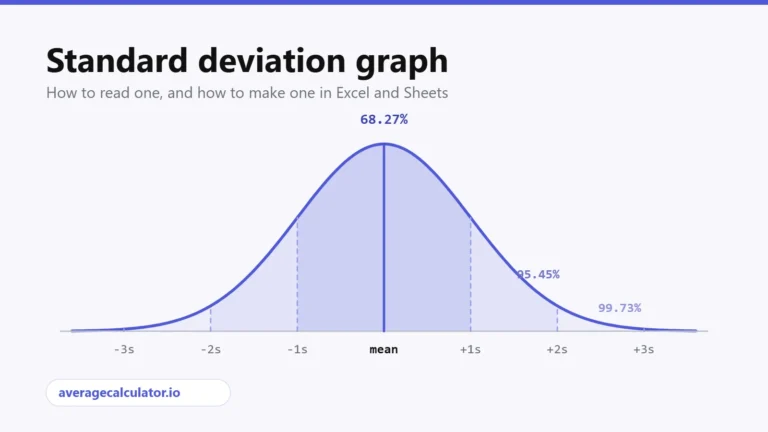
Standard deviation graph: how to read one and how to make one
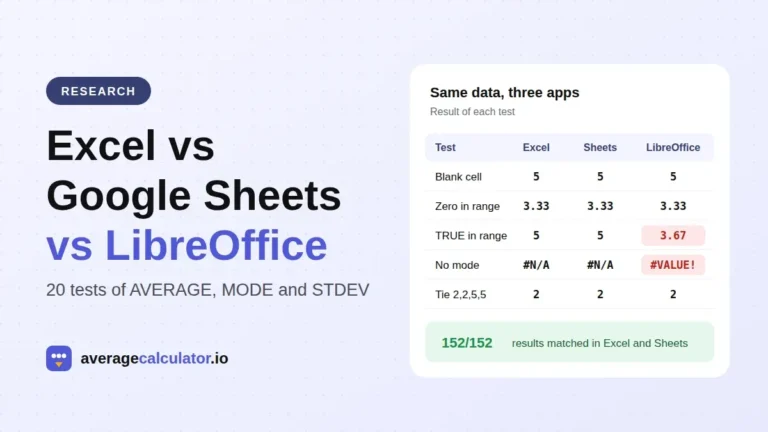
Excel vs Google Sheets vs LibreOffice: how average functions handle blanks, zeros and text
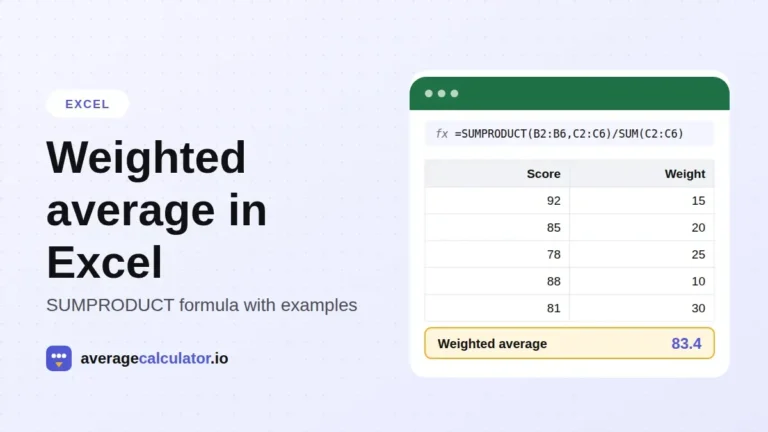
How to calculate a weighted average in Excel, with examples
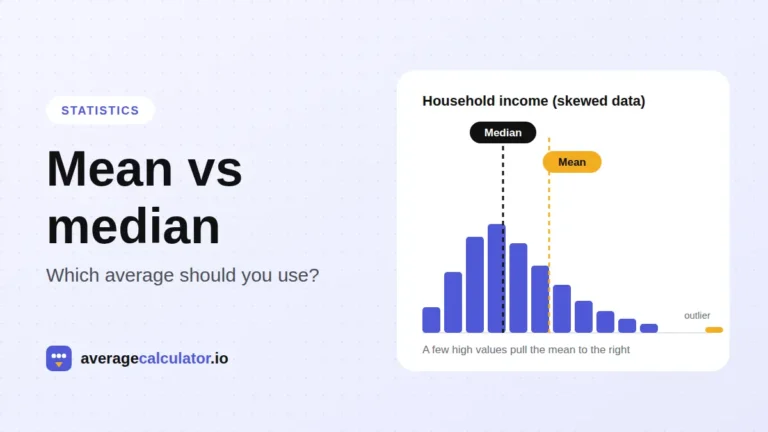
Mean vs median: which average should you use?
Who made this calculator
Spotted a mistake in this calculator? Tell us the numbers you used and what you expected, and we will check it.
Report an error