
IQR calculator
Paste your numbers and get the interquartile range, with Q1 and Q3, the 1.5 x IQR outlier fences and which values fall outside them. Switch between four quartile methods, because that is usually why your answer does not match the one in the book.

 By Danielle Valentine · Reviewed by Michael O'Brien✓ Fact-checked
Separate with commas, spaces or new lines. Text and blanks are skipped.
Not sure? Leave it on QUARTILE.INC. That is what Excel, Google Sheets and Python give you by default.
Outlier fences, the 1.5 x IQR rule
The same data, four quartile methods
Textbooks and software do not agree on where Q1 and Q3 sit. If your answer does not match the back of the book, this table usually explains why.
Sorted data
How this was worked out
How to use the IQR calculator
- Paste or type your numbers. Commas, spaces and new lines all work, and anything that is not a number is skipped.
- Leave the method on QUARTILE.INC unless your course says otherwise. That is what Excel, Google Sheets, Python and R give you by default.
- Press Calculate IQR. The interquartile range appears at the top, with Q1, the median and Q3 underneath.
- Read the fences. Anything below the lower fence or above the upper fence is flagged in amber in the sorted list.
- Check the four method table if your answer needs to match a particular textbook.
What the interquartile range is
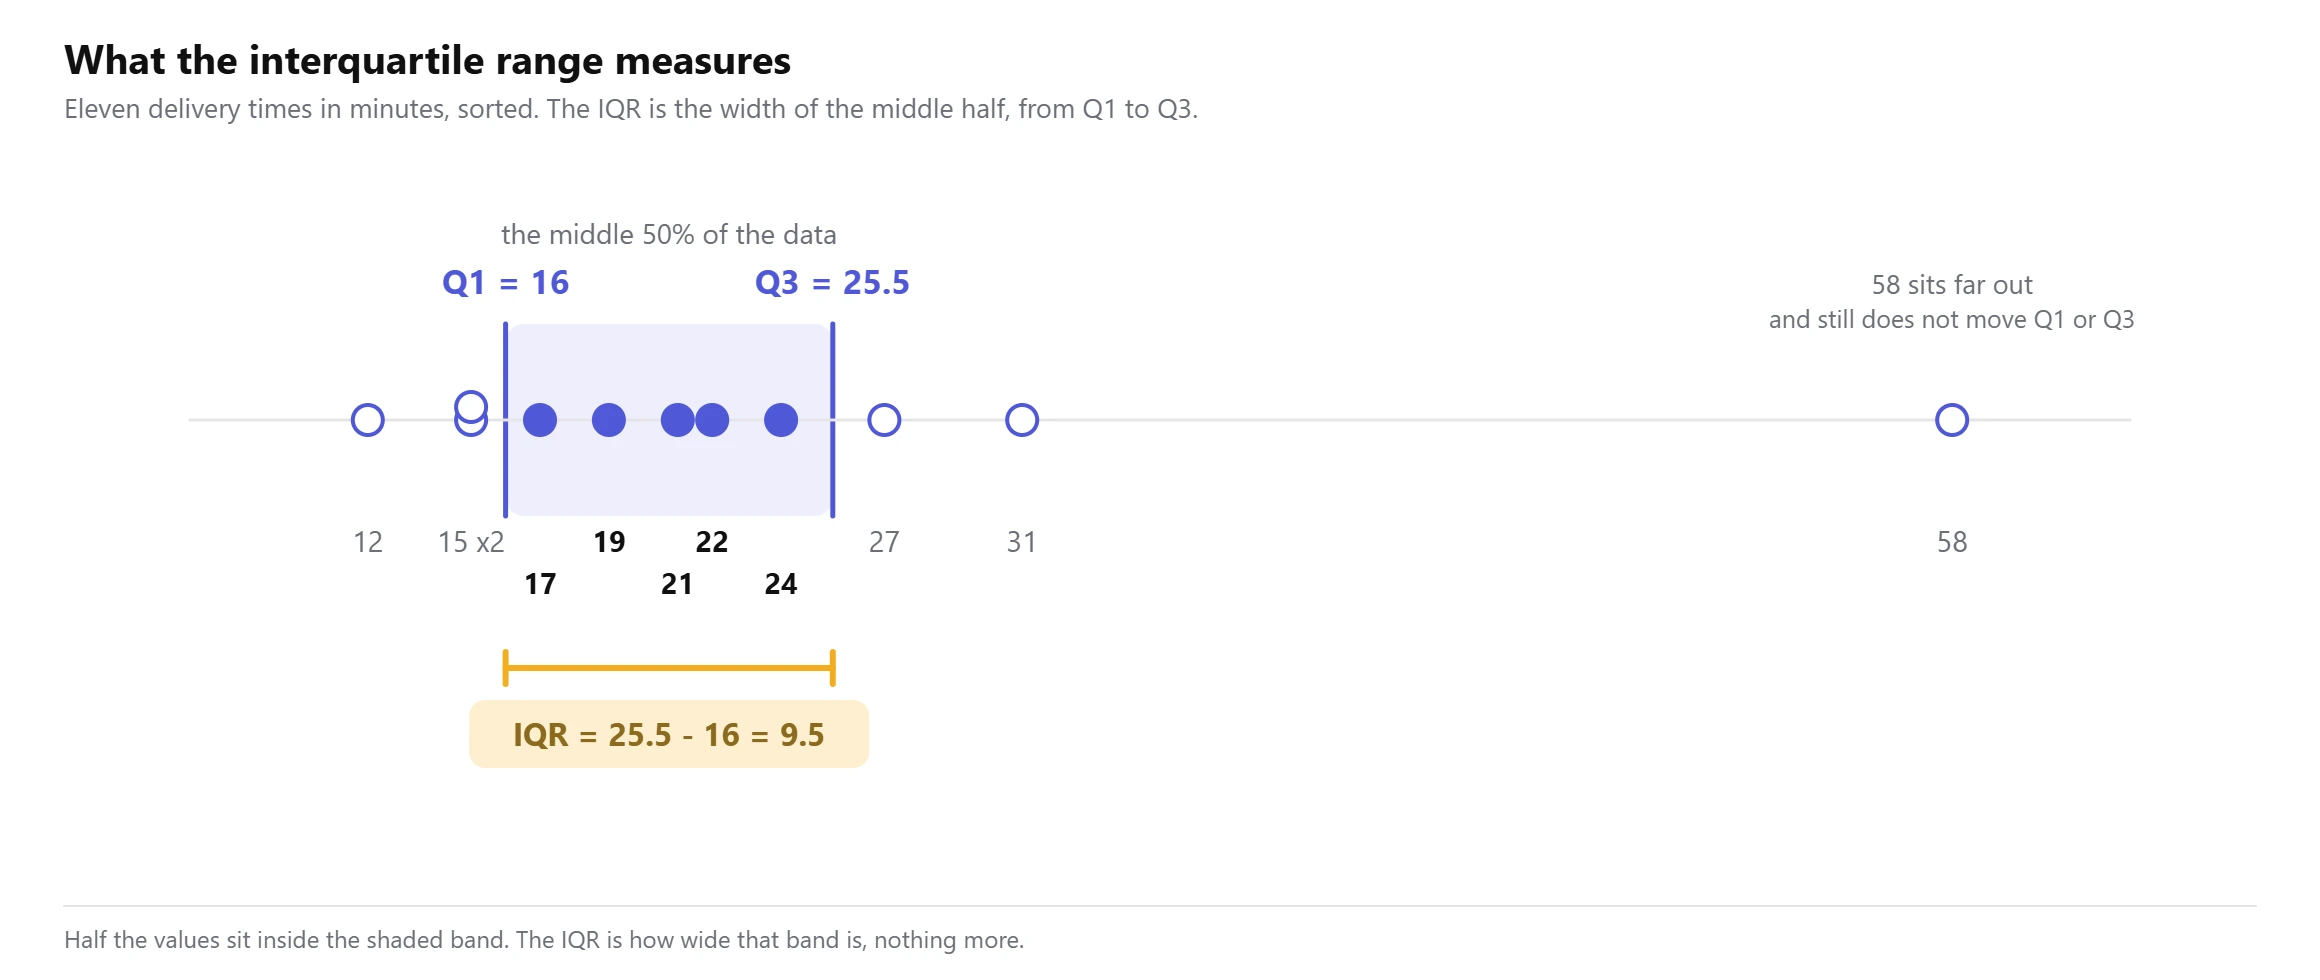
The interquartile range is the distance between the first quartile and the third quartile. Sort your data, cut it into four equal parts, and the IQR is the width of the middle two. It tells you how spread out the middle half of your data is.
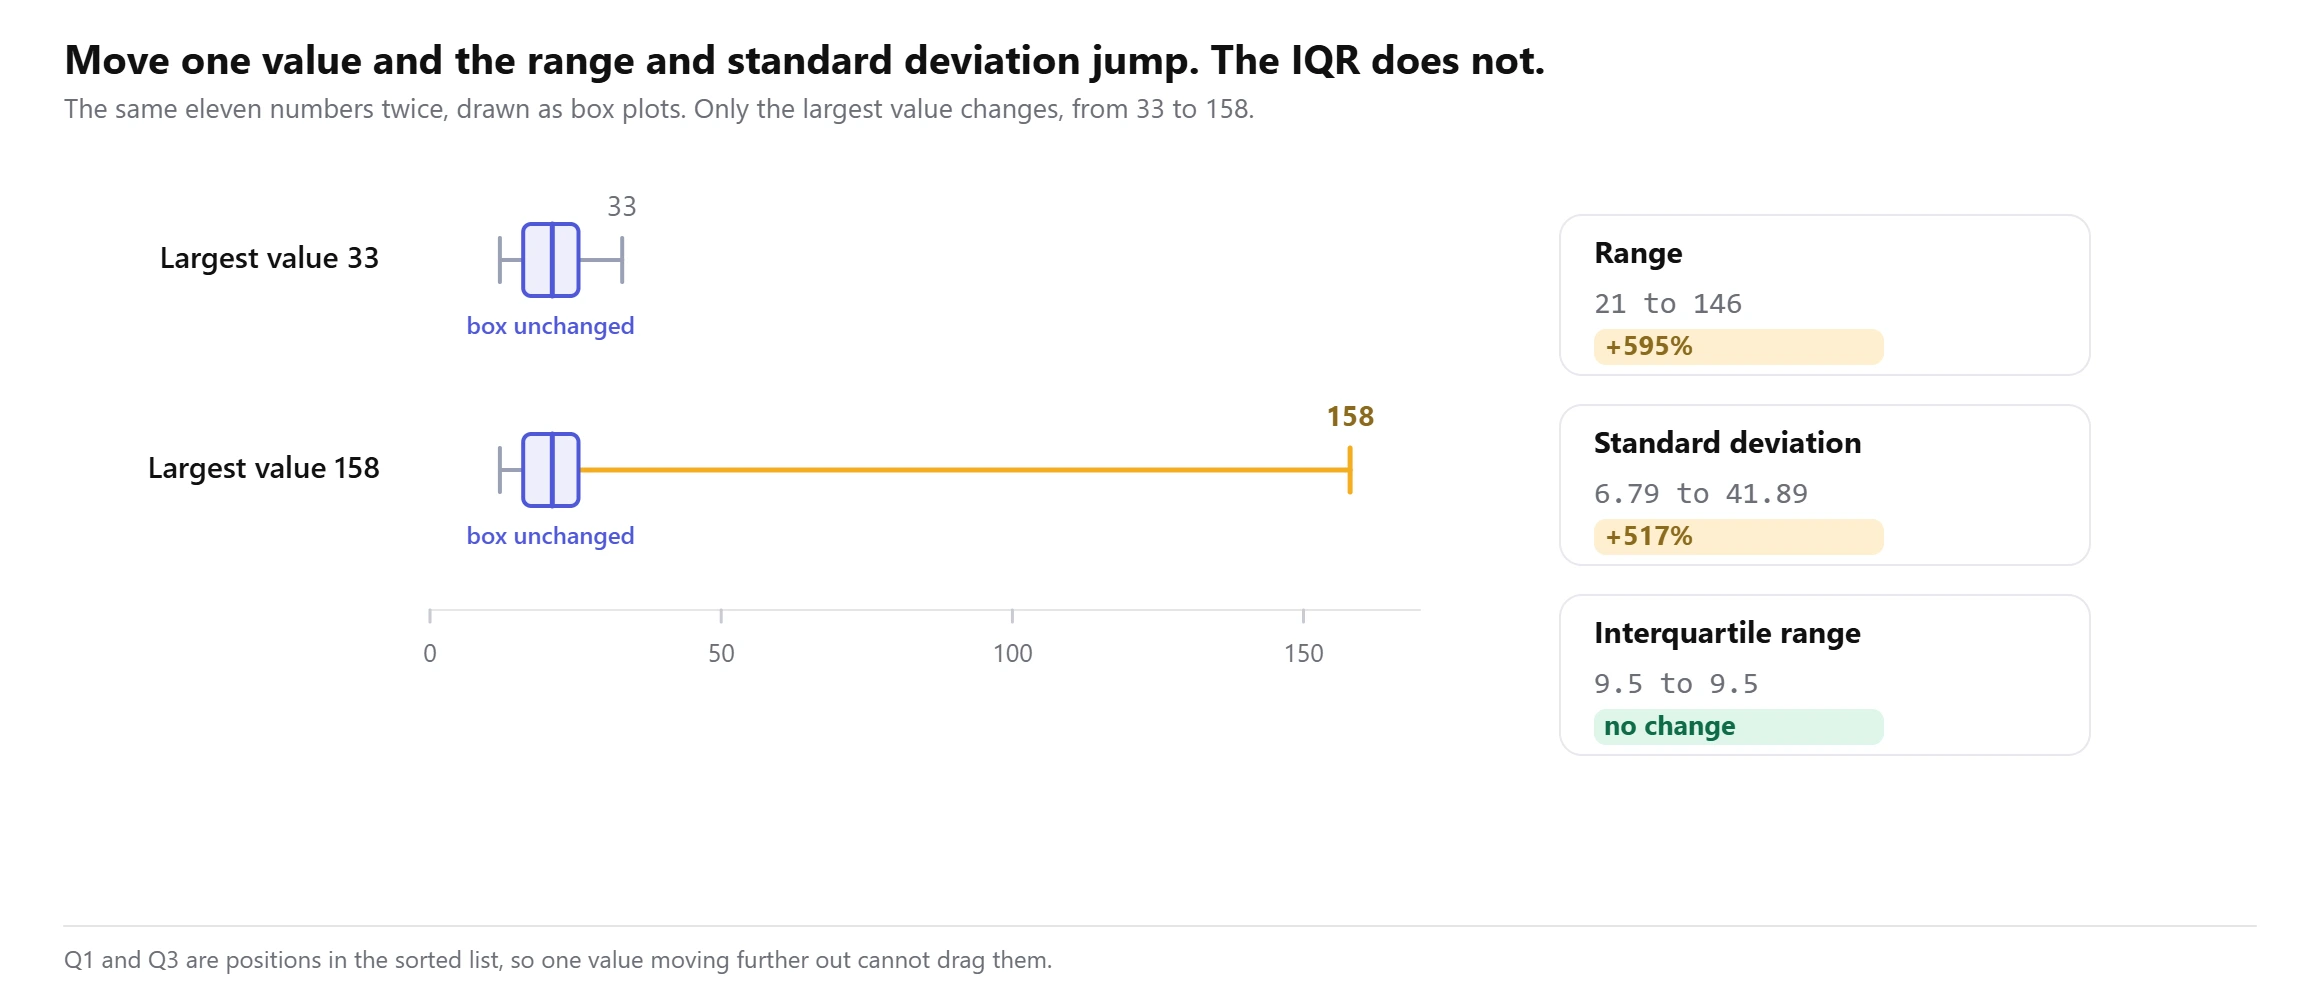
That middle half is the point. The range uses only the smallest and largest values, so one unusual number stretches it. The IQR ignores the outer quarters completely, which is why it survives an outlier that would wreck the range.
The IQR formula
IQR = Q3 – Q1
Q1 is the value a quarter of the way through the sorted data, also called the lower quartile or the 25th percentile. Q3 is three quarters of the way through, the upper quartile or 75th percentile. The subtraction is the simple part. Finding Q1 and Q3 is where the disagreement starts, and the next two sections deal with that.
A worked example, every step shown
A shop records orders on eleven days: 24, 15, 31, 12, 22, 58, 19, 17, 27, 21, 15.
Sorted, that is 12, 15, 15, 17, 19, 21, 22, 24, 27, 31, 58. Eleven values, so the median is the sixth one, 21.
Using QUARTILE.INC, Q1 sits at position 1 + (11 – 1) x 0.25 = 3.5, which is halfway between the third value, 15, and the fourth, 17. That gives Q1 = 16. Q3 sits at position 1 + (11 – 1) x 0.75 = 8.5, halfway between 24 and 27, so Q3 = 25.5.
IQR = 25.5 – 16 = 9.5
Now compare that with the range. The smallest value is 12 and the largest is 58, so the range is 46. One busy day has made the range almost five times the IQR. The middle half of this shop’s days sits inside a window of 9.5 orders, and the range never tells you that.
Why your Q1 does not match the textbook
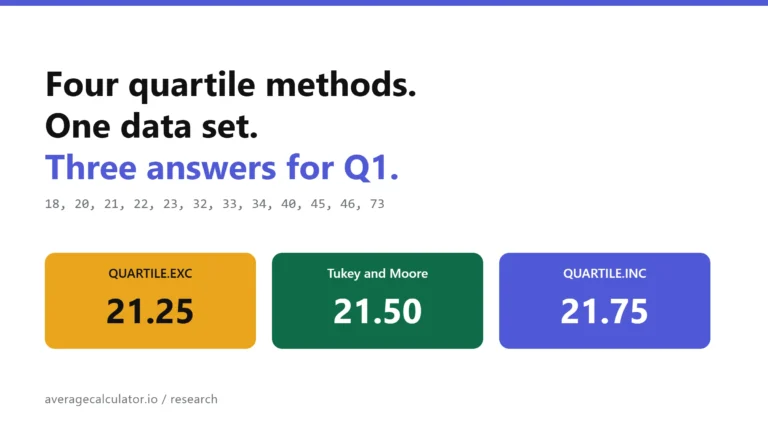
There is no single agreed definition of a quartile. When a data set has an odd number of values, the methods disagree about what to do with the median, and the answers come out different. Here is the same eleven day data set under all four:
| Method | Q1 | Q3 | IQR |
|---|---|---|---|
| QUARTILE.INC | 16 | 25.5 | 9.5 |
| QUARTILE.EXC | 15 | 27 | 12 |
| Tukey hinges | 16 | 25.5 | 9.5 |
| Moore and McCabe | 15 | 27 | 12 |
The split is between methods that keep the median in both halves and methods that drop it. Moore and McCabe, the version most US statistics courses teach, splits the eleven values at the median and throws the median away, leaving 12, 15, 15, 17, 19 below and 22, 24, 27, 31, 58 above. The medians of those halves are 15 and 27, so the IQR is 12.
Tukey keeps the median in both halves, giving 12, 15, 15, 17, 19, 21 and 21, 22, 24, 27, 31, 58, whose medians are 16 and 25.5. QUARTILE.INC interpolates to the same pair here. QUARTILE.EXC lands on the Moore and McCabe answer.
None of them is wrong. If you are checking homework, use the one your course uses. If you are reporting a result, say which method you used, because an IQR of 9.5 and an IQR of 12 describe the same eleven numbers, and across 23,760 data sets the four methods never once agreed. The five number summary calculator shows the same four methods alongside a box plot if you want to see where the quartiles land.
Finding the lower and upper quartile by hand
For the Moore and McCabe method, which is the one most often set in exams, the steps are short.
- Sort the values from smallest to largest.
- Find the median. With an odd count it is the middle value. With an even count it is the average of the two middle values.
- Take everything below the median as the lower half. With an odd count, leave the median itself out.
- The median of that lower half is Q1, the lower quartile.
- Do the same with the upper half to get Q3, the upper quartile.
- Subtract Q1 from Q3.
The trap is step 3. Whether the median goes into the halves or stays out is the whole difference between the methods, and it is the single most common reason a hand calculation disagrees with a spreadsheet.
The 1.5 x IQR rule for outliers
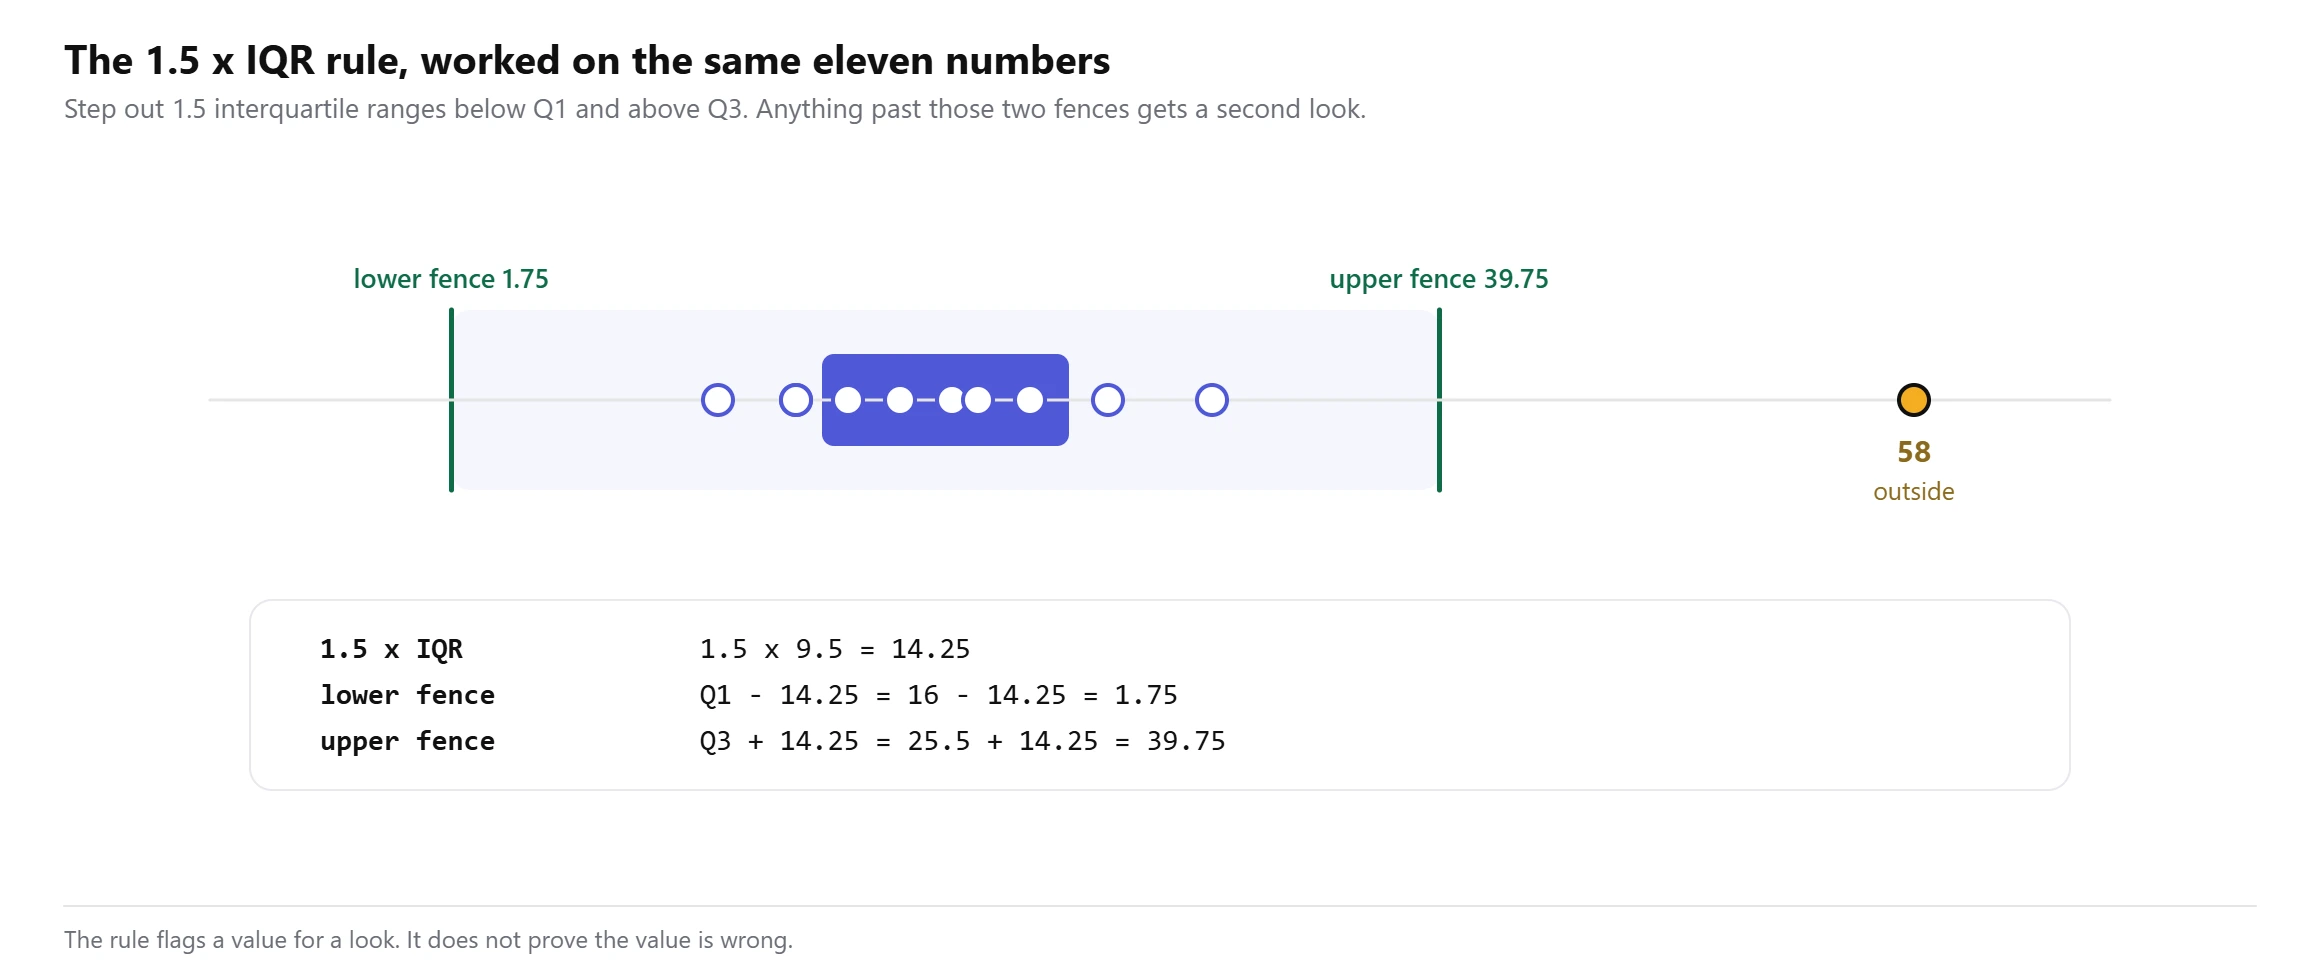
Once you have the IQR, the usual test for an unusual value is to build two fences:
lower fence = Q1 – 1.5 x IQR
upper fence = Q3 + 1.5 x IQR
On the shop data, 1.5 x 9.5 is 14.25, so the fences sit at 16 – 14.25 = 1.75 and 25.5 + 14.25 = 39.75. The 58 order day falls above the upper fence and gets flagged. Nothing falls below the lower one.
The 1.5 is a convention, not a law. John Tukey picked it because it flags about 0.7% of values from a normal distribution, which is rare enough to be interesting without flagging half your data. A flag means look at the value, not delete it. A 58 order day might be a sale, a bulk customer or a typo, and only you can tell which. The outlier calculator runs this rule next to the z-score and Grubbs tests, which often disagree with each other on the same numbers.
IQR in Excel and Google Sheets
Neither has an IQR function. You build it from two quartile calls:
=QUARTILE.INC(A2:A12,3) - QUARTILE.INC(A2:A12,1)The 1 asks for Q1 and the 3 asks for Q3. Swap in QUARTILE.EXC if your course uses the exclusive method. The older QUARTILE function still works and behaves like QUARTILE.INC, but it has been superseded, so new sheets should use the named versions.
Both functions skip blank cells and count zeros, and text inside the range is ignored rather than treated as zero. We tested that behaviour across Excel, Google Sheets and LibreOffice and found the three agree on quartiles but disagree elsewhere, which is written up in our spreadsheet study.
When the IQR beats the range and the standard deviation
Use the IQR when your data is skewed or has outliers. Incomes, house prices, response times and order sizes all have a long tail on one side, and a single large value moves both the range and the standard deviation while leaving the IQR alone. On the shop data the range is 46 and the sample standard deviation is 12.67, both pulled up by one day. The IQR is 9.5.
Use the standard deviation when the data is roughly symmetric and you need a number that feeds into other statistics, such as a confidence interval or a t test. The IQR does not feed into those.
Report the IQR alongside the median rather than the mean. The two are built the same way, from position in the sorted data rather than from the size of every value, so they tell a consistent story. Pairing a mean with an IQR reads oddly for the same reason. Our guide on the mean, median, mode and range covers which pairs go together.
Where IQR questions go wrong
You get Q1 and Q3 the right way round but forget to sort first. Quartiles are positions in sorted data, so an unsorted list gives a meaningless answer that still looks like a number.
Your spreadsheet says 16 and the answer key says 15. Check the method before you check your arithmetic. On an odd count those two numbers are usually QUARTILE.INC against Moore and McCabe, not a mistake.
You report a negative lower fence on data that cannot go below zero, such as waiting times or order counts. The arithmetic is right, the fence is out of reach, which means the rule will never flag a low outlier in that data set.
You treat a flagged value as an error and delete it. The 1.5 x IQR rule flags roughly 0.7% of values even when nothing is wrong, so on a large clean data set it will always find something.
Why use this IQR calculator?
What you get with this free IQR calculator:
- Q1, Q3 and the interquartile range from all four quartile methods at once, so you can see exactly where the disagreement comes from
- The 1.5 x IQR fences, and which of your values fall outside them
- Every step written out, the sorted values, the positions and the arithmetic, so you can check the result rather than trust it
- Every method labelled with where it is used, from Excel and numpy to the version taught in most US courses
- Commas, spaces, tabs or line breaks all work, and text and blank entries are skipped rather than counted as zero
- The arithmetic runs in your browser, so nothing you paste leaves your machine
- Free, with no sign up and no limit on how many times you run it
- Free to use
- No sign-up
- Four quartile methods
- Outlier fences
- Step by step working
Frequently asked questions
What is the IQR?
The interquartile range is the distance between the first quartile and the third quartile, so it measures how spread out the middle 50% of your data is. Because it ignores the top and bottom quarters, a single extreme value does not change it.
What is the formula for the interquartile range?
IQR = Q3 – Q1. Sort the data, find the value a quarter of the way through for Q1 and three quarters of the way through for Q3, then subtract.
How do I find the lower quartile?
Sort the values, find the median, then take the median of everything below it. With an odd number of values, most courses leave the median itself out of that lower half. That second median is Q1, the lower quartile.
Why does my calculator give a different Q1 from my textbook?
Because there is no single definition of a quartile. On an odd number of values, methods that keep the median in both halves give a different Q1 from methods that drop it. The calculator above shows all four answers so you can match the one your course uses.
What is the 1.5 x IQR rule?
It flags values below Q1 – 1.5 x IQR or above Q3 + 1.5 x IQR as possible outliers. The 1.5 is Tukey’s convention, chosen because it flags about 0.7% of values from a normal distribution. A flag is a prompt to look, not a reason to delete.
Is there an IQR function in Excel?
No. Subtract one quartile call from another: =QUARTILE.INC(A2:A12,3) – QUARTILE.INC(A2:A12,1). Google Sheets works the same way.
Can the IQR be zero?
Yes. If at least half your values are identical, Q1 and Q3 can land on the same number and the IQR is zero. That is a real result, and it means the middle half of the data has no spread at all.
How many numbers do I need?
Four is the practical minimum, and QUARTILE.EXC needs four before Q1 and Q3 fall inside the data at all. Below about ten values the IQR moves a lot when one number changes, so treat it as rough.
Explore our other calculators
 Average calculator
 Average percentage calculator
 Average time calculator
 Degrees of freedom calculator
 Exponential Regression Calculator
 Five Number Summary Calculator
 Histogram maker
 Linear regression calculator
 Mean, Median, Mode and Range Calculator
 Outlier Calculator
 Pie Chart Maker
 Probability Calculator
 Standard deviation calculator
 Sum of Squares Calculator
 Variance calculator
 Weighted average calculator
Our latest blogs
Four quartile methods, one data set, three answers for Q1
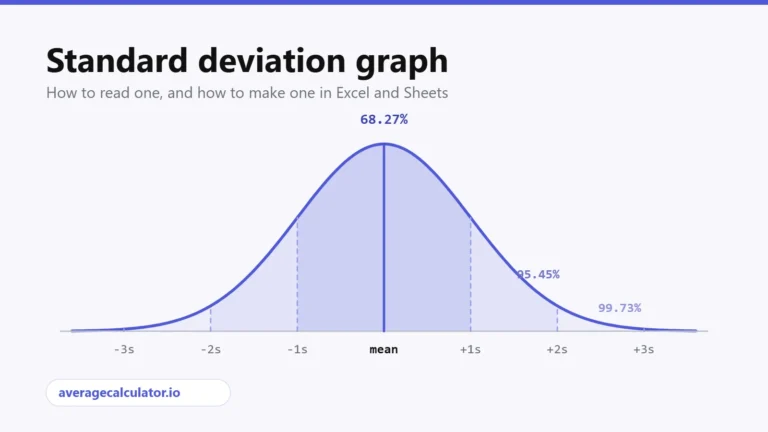
Standard deviation graph: how to read one and how to make one
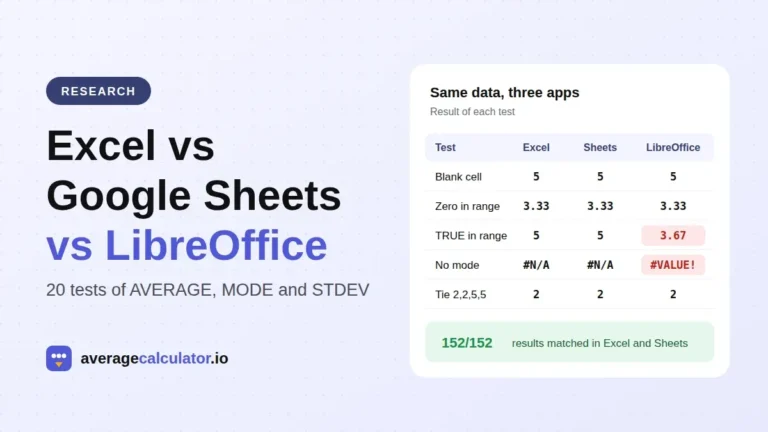
Excel vs Google Sheets vs LibreOffice: how average functions handle blanks, zeros and text
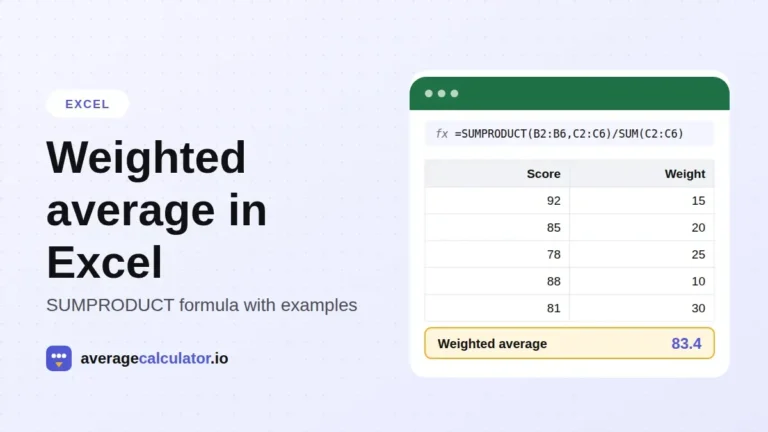
How to calculate a weighted average in Excel, with examples
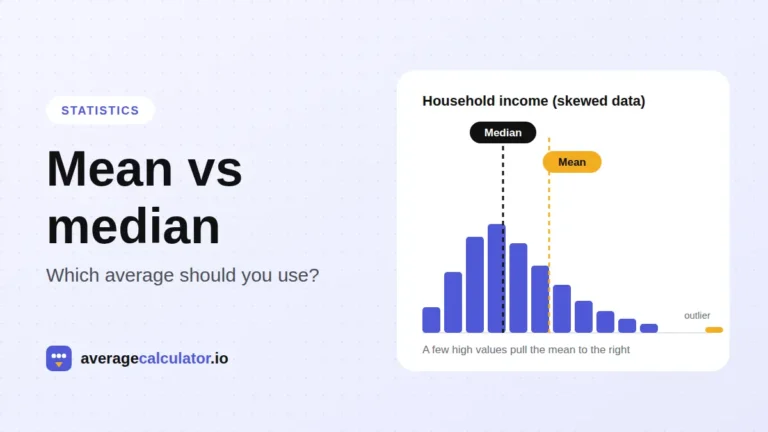
Mean vs median: which average should you use?
Who made this calculator
Spotted a mistake in this calculator? Tell us the numbers you used and what you expected, and we will check it.
Report an error